pattern
Plot antenna or transducer element directivity and patterns
Syntax
Description
pattern(___, plots the
element pattern with additional options specified by one or more Name=Value)Name=Value
pair arguments.
[
returns the element pattern in PAT,AZ_ANG,EL_ANG] = pattern(___)PAT. The AZ_ANG output
contains the coordinate values corresponding to the rows of PAT. The
EL_ANG output contains the coordinate values corresponding to the columns
of PAT. If the 'CoordinateSystem' parameter is set to
'uv', then AZ_ANG contains the U
coordinates of the pattern and EL_ANG contains the V
coordinates of the pattern. Otherwise, they are in angular units in degrees.
UV units are dimensionless.
Input Arguments
Antenna or transducer element, specified as a Phased Array System Toolbox System object.
Frequencies for computing directivity and patterns, specified as a positive scalar or 1-by-L real-valued row vector. Frequency units are in Hz.
For an antenna, microphone, or sonar hydrophone or projector element,
FREQmust lie within the range of values specified by theFrequencyRangeorFrequencyVectorproperty of the element. Otherwise, the element produces no response and the directivity is returned as–Inf. Most elements use theFrequencyRangeproperty except forphased.CustomAntennaElementandphased.CustomMicrophoneElement, which use theFrequencyVectorproperty.For an array of elements,
FREQmust lie within the frequency range of the elements that make up the array. Otherwise, the array produces no response and the directivity is returned as–Inf.
Example: [1e8 2e6]
Data Types: double
Azimuth angles for computing directivity and pattern, specified as a 1-by-N real-valued row vector where N is the number of azimuth angles. Angle units are in degrees. Azimuth angles must lie between –180° and 180°.
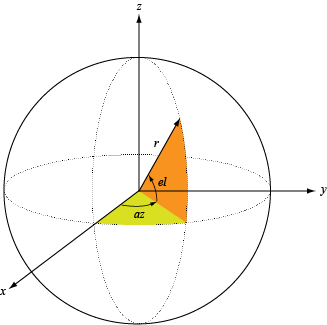
The azimuth angle is the angle between the x-axis and the projection of the direction vector onto the xy plane. When measured from the x-axis toward the y-axis, this angle is positive.
Example: [-45:2:45]
Data Types: double
Elevation angles for computing directivity and pattern, specified as a 1-by-M real-valued row vector where M is the number of desired elevation directions. Angle units are in degrees. The elevation angle must lie between –90° and 90°.
The elevation angle is the angle between the direction vector and xy-plane. The elevation angle is positive when measured towards the z-axis.
Example: [-75:1:70]
Data Types: double
Name-Value Arguments
Specify optional pairs of arguments as
Name1=Value1,...,NameN=ValueN, where Name is
the argument name and Value is the corresponding value.
Name-value arguments must appear after other arguments, but the order of the
pairs does not matter.
Before R2021a, use commas to separate each name and value, and enclose
Name in quotes.
Example: CoordinateSystem="polar",Type="directivity"
Plotting coordinate system of the pattern, specified as the equal sign separated pair
consisting of CoordinateSystem and one of "polar",
"rectangular", or "uv". When
CoordinateSystem is set to "polar" or
"rectangular", the AZ and
EL arguments specify the pattern azimuth and elevation,
respectively. AZ values must lie between –180° and 180°.
EL values must lie between –90° and 90°. If
CoordinateSystem is set to "uv",
AZ and EL then specify
U and V coordinates, respectively.
AZ and EL must lie between -1 and
1.
Example: "uv"
Data Types: char
Displayed pattern type, specified as the equal-sign-separated pair consisting of
Type and one of
"directivity"— directivity pattern measured in dBi."efield"— field pattern of the sensor or array. For acoustic sensors, the displayed pattern is for the scalar sound field."power"— power pattern of the sensor or array defined as the square of the field pattern."powerdb"— power pattern converted to dB.
Example: "powerdb"
Data Types: char
Display normalized pattern, specified as the equal sign separated pair consisting of
Normalize and a Boolean. Set this parameter to
true to display a normalized pattern. This parameter does not
apply when you set Type to "directivity".
Directivity patterns are already normalized.
Data Types: logical
Polarization type, specified as the equal-sign-separated pair consisting of
Polarization and either "combined",
"H", or "V". If Polarization is
"combined", the horizontal and vertical polarization patterns are
combined. If Polarization is "H", only the horizontal
polarization is displayed. If Polarization is "V",
only the vertical polarization is displayed.
Dependencies
To enable this property, set the element argument to an antenna
that supports polarization: phased.CrossedDipoleAntennaElement, phased.ShortDipoleAntennaElement, or phased.CustomAntennaElement, and then set the Type name-value
pair to "efield", "power", or
"powerdb".
Data Types: char | string
Output Arguments
More About
Directivity describes the directionality of the radiation pattern of a sensor element or array of sensor elements.
Higher directivity is desired when you want to transmit more radiation in a specific direction. Directivity is the ratio of the transmitted radiant intensity in a specified direction to the radiant intensity transmitted by an isotropic radiator with the same total transmitted power
where Urad(θ,φ) is the radiant intensity of a transmitter in the direction (θ,φ) and Ptotal is the total power transmitted by an isotropic radiator. For a receiving element or array, directivity measures the sensitivity toward radiation arriving from a specific direction. The principle of reciprocity shows that the directivity of an element or array used for reception equals the directivity of the same element or array used for transmission. When converted to decibels, the directivity is denoted as dBi. For information on directivity, read the notes on Element Directivity and Array Directivity.
The azimuth angle of a vector is the angle between the x-axis and its orthogonal projection onto the xy-plane. The angle is positive when going from the x-axis toward the y-axis. Azimuth angles lie between –180° and 180° degrees, inclusive. The elevation angle is the angle between the vector and its orthogonal projection onto the xy-plane. The angle is positive when going toward the positive z-axis from the xy-plane. Elevation angles lie between –90° and 90° degrees, inclusive.
Algorithms
For antenna, transducer, and array System objects, the
pattern function replaces the plotResponse function.
In addition, two new simplified functions exist just to draw 2-D azimuth and elevation pattern
plots. These functions are patternAzimuth and
patternElevation.
The following table is a guide for converting your code from using
plotResponse to pattern. Notice that some of the
inputs have changed from input arguments to Name-Value
pairs and conversely. The general pattern method syntax
is
pattern(H,FREQ,AZ,EL,'Name1'='Value1',...,'NameN'='ValueN')
| plotResponse Inputs | plotResponse Description | pattern Inputs | ||||||||||||||||||||
|---|---|---|---|---|---|---|---|---|---|---|---|---|---|---|---|---|---|---|---|---|---|---|
H argument | Antenna, microphone, or array System object. | H argument (no change) | ||||||||||||||||||||
FREQ argument | Operating frequency. | FREQ argument (no change) | ||||||||||||||||||||
V argument | Propagation speed. This argument is used only for arrays. | "PropagationSpeed" name-value pair. This parameter is only used for
arrays. | ||||||||||||||||||||
"Format" and "RespCut" name-value pairs | These options work together to let you create a plot
in angle space (line or polar style) or UV space.
They also determine whether the plot is 2-D or 3-D. This table shows
you how to create different types of plots using
|
If you set | ||||||||||||||||||||
"CutAngle" name-value pair | Constant angle at to take an azimuth or elevation cut. When producing a 2-D plot and when
"RespCut" is set to "Az" or
"El", use "CutAngle" to set the slice
across which to view the plot. | No equivalent name-value pair. To create a cut, specify either AZ or EL as
a scalar, not a vector. | ||||||||||||||||||||
"NormalizeResponse" name-value pair | Normalizes the plot. When "Unit" is set to "dbi", you
cannot specify "NormalizeResponse". | Use the | ||||||||||||||||||||
"OverlayFreq" name-value pair | Plot multiple frequencies on the same 2-D plot. Available only when
"Format" is set to "line" or
"uv" and "RespCut" is not set to
"3D". The value true produces an
overlay plot and the value false produces a waterfall plot. |
The values | ||||||||||||||||||||
"Polarization" name-value pair | Determines how to plot polarized fields. Options are "None",
"Combined", "H", or
"V". | "Polarization" name-value pair determines how to plot polarized fields.
The "None" option is removed. The options
"Combined", "H", or
"V" are unchanged. | ||||||||||||||||||||
"Unit" name-value pair | Determines the plot units. Choose "db", "mag",
"pow", or "dbi", where the default is
"db". |
| ||||||||||||||||||||
"Weights" name-value pair | Array element tapers (or weights). | "Weights" name-value pair (no change). | ||||||||||||||||||||
"AzimuthAngles" name-value pair | Azimuth angles used to display the antenna or array response. |
| ||||||||||||||||||||
"ElevationAngles" name-value pair | Elevation angles used to display the antenna or array response. |
| ||||||||||||||||||||
"UGrid" name-value pair | Contains U coordinates in UV-space. |
| ||||||||||||||||||||
"VGrid" name-value pair | Contains V-coordinates in UV-space. |
|
Version History
Introduced in R2019a
See Also
MATLAB Command
You clicked a link that corresponds to this MATLAB command:
Run the command by entering it in the MATLAB Command Window. Web browsers do not support MATLAB commands.
Website auswählen
Wählen Sie eine Website aus, um übersetzte Inhalte (sofern verfügbar) sowie lokale Veranstaltungen und Angebote anzuzeigen. Auf der Grundlage Ihres Standorts empfehlen wir Ihnen die folgende Auswahl: .
Sie können auch eine Website aus der folgenden Liste auswählen:
So erhalten Sie die bestmögliche Leistung auf der Website
Wählen Sie für die bestmögliche Website-Leistung die Website für China (auf Chinesisch oder Englisch). Andere landesspezifische Websites von MathWorks sind für Besuche von Ihrem Standort aus nicht optimiert.
Amerika
- América Latina (Español)
- Canada (English)
- United States (English)
Europa
- Belgium (English)
- Denmark (English)
- Deutschland (Deutsch)
- España (Español)
- Finland (English)
- France (Français)
- Ireland (English)
- Italia (Italiano)
- Luxembourg (English)
- Netherlands (English)
- Norway (English)
- Österreich (Deutsch)
- Portugal (English)
- Sweden (English)
- Switzerland
- United Kingdom (English)