phased.CFARDetector2D
Two-dimensional CFAR detector
Description
phased.CFARDetector2D
System object™ implements a constant false-alarm rate detector (CFAR) for selected
elements (called cells) of two-dimensional image data. A detection is declared when an
image cell value exceeds a threshold. To maintain a constant false alarm-rate, the
threshold is set to a multiple of the image noise power. The detector estimates noise
power for a cell-under-test (CUT) from surrounding cells using
one of three cell averaging methods, or an order statistics method. The cell-averaging
methods are cell averaging (CA), greatest-of cell averaging (GOCA), or smallest-of cell
averaging (SOCA).
For each test cell, the detector:
Estimates the noise statistic from the cell values in the training band surrounding the CUT cell.
Computes the threshold by multiplying the noise estimate by the threshold factor.
Compares the CUT cell value to the threshold to determine whether a target is present or absent. If the value is greater than the threshold, a target is present.
detector = phased.CFARDetector2Ddetector.
To run the 2-D CFAR detector:
Create the
phased.CFARDetector2Dobject and set its properties.Call the object with arguments, as if it were a function.
To learn more about how System objects work, see What Are System Objects?
Creation
Description
detector = phased.CFARDetector2D creates a 2-D CFAR
detector object, detector.
detector = phased.CFARDetector2D(Name,Value)detector, with each specified property
Name set to the specified Value.
You can specify additional name-value pair arguments in any order as
(Name1,Value1,...,NameN,ValueN).
Properties
Usage
Description
[Y,th] = detector(___) also returns the
detection threshold, th, applied to detected cells
under test. To enable this syntax, set the
ThresholdOutputPort property to
true.
Input Arguments
Output Arguments
Object Functions
To use an object function, specify the
System object as the first input argument. For
example, to release system resources of a System object named obj, use
this syntax:
release(obj)
Examples
This example shows how to set a 2-D CFAR threshold based upon a required probability of false alarm (pfa).
Perform cell-averaging CFAR detection on a 41-by-41 matrix of cells containing Gaussian noise. Estimate the empirical pfa and compare it to the required pfa. To get a good estimate, perform this simulation on 1000 similar matrices. First, set a threshold using the required pfa. In this case, there are no targets and the pfa can be estimated from the number of cells that exceed the threshold. Assume that the data is processed through a square-law detector and that no pulse integration is performed. Use a training-cell band of 3 cells in width and 4 cells in height. Use a guard band of 3 cells in width and 2 cells in height to separate the cells under test (CUT) from the training cells. Specify a required pfa of 5.0e-4.
p = 5e-4;
rs = RandStream.create('mt19937ar','Seed',5);
N = 41;
ntrials = 1000;
detector = phased.CFARDetector2D('TrainingBandSize',[4,3], ...
    'ThresholdFactor','Auto','GuardBandSize',[2,3], ...
    'ProbabilityFalseAlarm',p,'Method','SOCA','ThresholdOutputPort',true);
Create a 41-by-41 image containing random complex data. Then, square the data to simulate a square-law detector.
x = 2/sqrt(2)*(randn(rs,N,N,ntrials) + 1i*randn(rs,N,N,ntrials));
x2 = abs(x).^2;
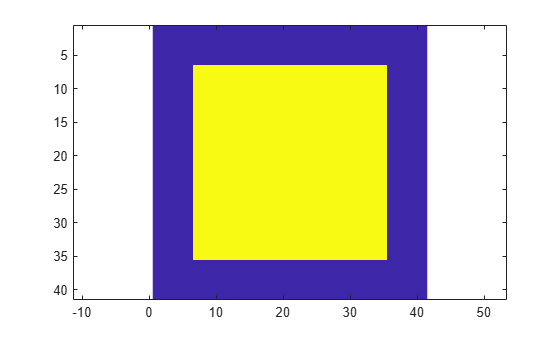
Process all the cells in each image. To do this, find the row and column of each CUT cell whose training region falls entirely within each image.
Ngc = detector.GuardBandSize(2);
Ngr = detector.GuardBandSize(1);
Ntc = detector.TrainingBandSize(2);
Ntr = detector.TrainingBandSize(1);
cutidx = [];
colstart = Ntc + Ngc + 1;
colend = N - ( Ntc + Ngc);
rowstart = Ntr + Ngr + 1;
rowend = N - ( Ntr + Ngr);
for m = colstart:colend
    for n = rowstart:rowend
        cutidx = [cutidx,[n;m]];
    end
end
ncutcells = size(cutidx,2);
Display the CUT cells.
cutimage = zeros(N,N);
for k = 1:ncutcells
    cutimage(cutidx(1,k),cutidx(2,k)) = 1;
end
imagesc(cutimage)
axis equal
Perform the detection on all CUT cells. Return the detection classification and the threshold used to classify the cell.
[dets,th] = detector(x2,cutidx);
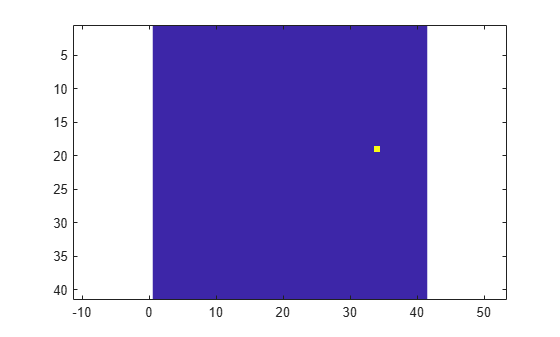
Find and display an image with a false alarm for illustration.
di = [];
for k = 1:ntrials
    d = dets(:,k);
    if (any(d) > 0)
        di = [di,k];
    end
end
idx = di(1);
detimg = zeros(N,N);
for k = 1:ncutcells
    detimg(cutidx(1,k),cutidx(2,k)) = dets(k,idx);
end
imagesc(detimg)
axis equal
Compute the empirical pfa.
pfa = sum(dets(:))/ntrials/ncutcells
pfa =
4.5898e-04
The empirical and specified pfa agree.
Display the average empirical threshold value over all images.
mean(th(:))
ans =
31.7139
Compute the theoretical threshold factor for the required pfa.
threshfactor = npwgnthresh(p,1,'noncoherent');
threshfactor = 10^(threshfactor/10);
disp(threshfactor)
7.6009
The theoretical threshold factor multiplied by the noise variance should agree with the measured threshold.
noisevar = mean(x2(:));
disp(threshfactor*noisevar);
30.4118
The theoretical threshold and empirical threshold agree to within an acceptable difference.
Perform cell-averaging CFAR detection on a 41-by-41 matrix of cells containing five closely-spaced targets in Gaussian noise. Perform this detection on a simulation of 1000 images. Use two detectors with different guard band regions. Set the thresholds manually using the Custom threshold factor. Assume that the data is processed through a square law-detector and that no pulse integration is performed. Use a training cell band of 2 cells in width and 2 cells in height. For the first detector, use a guard band of 1 cell all around to separate the CUT cells from the training cells. For the second detector, use a guard band of 8 cells all around.
p = 5e-4;
rs = RandStream.create('mt19937ar','Seed',5);
N = 41;
ntrials = 1000;
Create 1000 41-by-41 images of complex random noise with standard deviation of 1.
s = 1;
x = s/sqrt(2)*(randn(rs,N,N,ntrials) + 1i*randn(rs,N,N,ntrials));
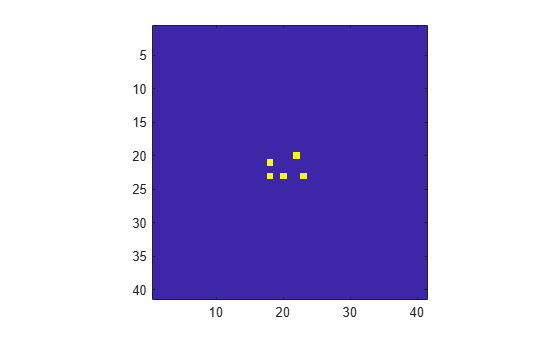
Set the target cells values to 1.5. Then, square the cell values.
A = 1.5;
x(23,20,:) = A;
x(23,18,:) = A;
x(23,23,:) = A;
x(20,22,:) = A;
x(21,18,:) = A;
x2 = abs(x).^2;
Display the target cells.
xtgt = zeros(N,N);
xtgt(23,20,:) = A;
xtgt(23,18,:) = A;
xtgt(23,23,:) = A;
xtgt(20,22,:) = A;
xtgt(21,18,:) = A;
imagesc(xtgt)
axis equal
axis tight
Set the CUT cells to be the target cells.
cutidx(1,1) = 23;
cutidx(2,1) = 20;
cutidx(1,2) = 23;
cutidx(2,2) = 18;
cutidx(1,3) = 23;
cutidx(2,3) = 23;
cutidx(1,4) = 20;
cutidx(2,4) = 22;
cutidx(1,5) = 21;
cutidx(2,5) = 18;
Perform the detection on all CUT cells using two CFAR 2-D detectors. The first detector has a small guard band region. The training region can include neighboring targets which can affect the computation of the noise power. The second detector has a larger guard band region, which precludes target cells from being used in the noise computation.
Create the two CFAR detectors.
detector1 = phased.CFARDetector2D('TrainingBandSize',[2,2], ...
    'GuardBandSize',[1,1],'ThresholdFactor','Custom','Method','CA', ...
    'CustomThresholdFactor',2,'ThresholdOutputPort',true);
detector2 = phased.CFARDetector2D('TrainingBandSize',[2,2], ...
    'GuardBandSize',[8,8],'ThresholdFactor','Custom','Method','CA', ...
    'CustomThresholdFactor',2,'ThresholdOutputPort',true);
Return the detection classifications and the thresholds used to classify the cells. Then, compute the probabilities of detection.
[dets1,th1] = detector1(x2,cutidx);
ndets = numel(dets1(:));
pd1 = sum(dets1(:))/ndets
pd1 =
0.6416
[dets2,th2] = detector2(x2,cutidx);
pd2 = sum(dets2(:))/ndets
pd2 =
0.9396
The detector with the larger guard-band region has a higher pfa because the noise is more accurately estimated.
More About
CFAR 2-D requires an estimate of the noise power. Noise power is computed from cells that are assumed not to contain any target signal. These cells are the training cells. Training cells form a band around the cell-under-test (CUT) cell but may be separated from the CUT cell by a guard band. The detection threshold is computed by multiplying the noise power by the threshold factor.

For GOCA and SOCA averaging, the noise power is derived from the mean value of one of the left or right halves of the training cell region.
Because the number of columns in the training region is odd, the cells in the middle column are assigned equally to either the left or right half.
When using the order-statistic method, the rank cannot be larger than the number of cells in the training cell region, Ntrain. You can compute Ntrain.
NTC is the number of training band columns.
NTR is the number of training band rows.
NGC is the number of guard band columns.
NGR is the number of guard band rows.
The total number of cells in the combined training region, guard region, and CUT cell is Ntotal = (2NTC + 2NGC + 1)(2NTR+ 2NGR + 1).
The total number of cells in the combined guard region and CUT cell is Nguard = (2NGC + 1)(2NGR + 1).
The number of training cells is Ntrain = Ntotal – Nguard.
By construction, the number of training cells is always even. Therefore, to implement a median filter, you can choose a rank of Ntrain/2 or Ntrain/2 + 1.
Algorithms
References
[1] Mott, H. Antennas for Radar and Communications. New York: John Wiley & Sons, 1992.
[2] Richards, M. A. Fundamentals of Radar Signal Processing. New York: McGraw-Hill, 2005.
[3] Skolnik, M. Introduction to Radar Systems, 3rd Ed. New York: McGraw-Hill, 2001.
Extended Capabilities
Version History
Introduced in R2016b