Plot Position of GNSS Receiver Using Live NMEA Data or NMEA Log File
This example shows how to parse information from NMEA sentences and use the obtained information to plot the location. In this example, you use the nmeaParser system object available in Navigation Toolbox™ to:
Get the latitude and longitude from the live data obtained from a GNSS receiver and plot the location in a map.
Get the latitude and longitude from the NMEA sentences stored in a log file and plot the location in a map.
Get the position information of the satellites in view and plot the satellite azimuth and elevation data using
skyplot.
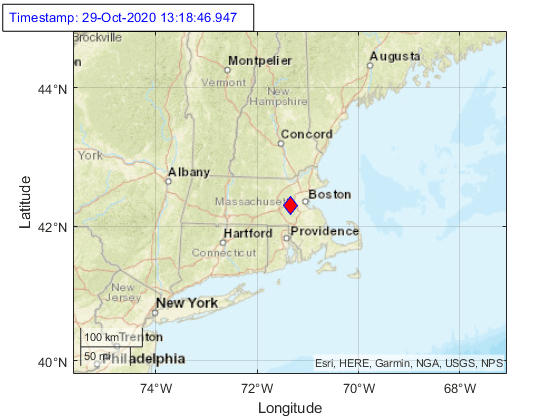
Plot Location Using Live NMEA Data from a GNSS Receiver
You can read the location given by GNSS receiver connected to the host PC and plot the live location data. The latitude and longitude used to plot the location can be obtained from multiple NMEA sentences. In this section, we are using the RMC sentences obtained from the receiver to extract latitude and longitude.
Required Hardware
Ublox NEO-6M GPS Module
Serial-to-USB signal converters like FTDI (if the GPS module cannot be directly connected to computer using USB)
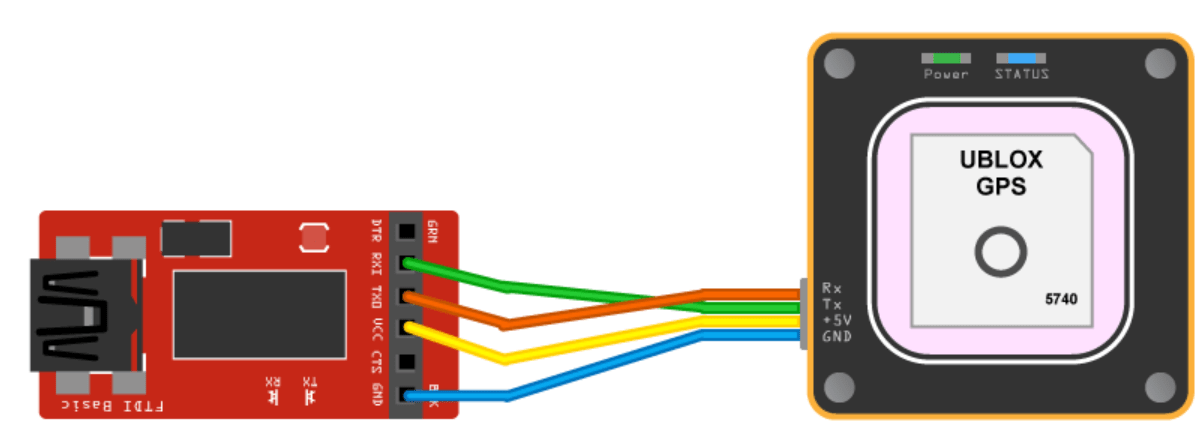
Hardware Setup
If a USB connector is available on the receiver, use a USB cable to connect the module directly to the host computer with Navigation Toolbox installed, and install the required drivers for the module. Otherwise, use serial-to-USB converters, to convert the serial transmissions to USB signals.
GNSS receivers require satellite signals to determine position information. The signals are acquired easily in locations that have a clear view of the sky. Ensure that you keep the module or receiver antenna in such a way so that it gets a clear view to the sky. The receiver might take some time to acquire signals.
Connect to Receiver and Parse NMEA Data
Create a connection to the serial port where the GNSS receiver is connected by specifying the port and baudrate.
% Create a serial object.
port = 'com8';
baudrate = 9600;
gpsObj = serialport(port,baudrate);
Create a nmeaParser object by specifying the Message ID of the sentence to be parsed as "RMC"
parserObj = nmeaParser("MessageId","RMC");
Read the values obtained from the receiver, parse the value to get the latitude and longitude, and plot the location on a map along with the timestamp, for a duration specified by timeOut.
an = [];
timeOut = 10;
ts = tic;
while(toc(ts)<timeOut)
    % Read line by line from the serial object.
    data = readline(gpsObj);
    rmcData = parserObj(data);
    % Status = 0, indicates, the input NMEA sentence is an valid RMC
    % sentence.
    if rmcData.Status == 0
        fixStatus = rmcData.FixStatus;
        latitude = rmcData.Latitude;
        longitude = rmcData.Longitude;
        gpsTime = rmcData.UTCDateTime;
        % Plot the position in geographic coordinates.
        geoplot(latitude,longitude,'Marker',"diamond",'MarkerSize',10,'Color','b', ...
            'MarkerFaceColor','r');
        % Selects the basemap.
        geobasemap streets;
        % Fix Status A represents the satellite fix is obtained.
        if fixStatus == "A"
            % Adjust the geographic limits of the current geographic axes.
            geolimits([latitude-2.5,latitude+2.5],[longitude-2.5,longitude+2.5]) ;
            txt = strcat("Timestamp: ",string(gpsTime));
        else
            txt =  "No Fix";
        end
        % Update time or Fix Status on the figure.
        delete(an);
        an = annotation('textbox', [0.005, 0.98, 0.6, 0.01], 'FitBoxToText','on', ...
            'string', txt,'Color','blue','FontSize',10);
    end
end
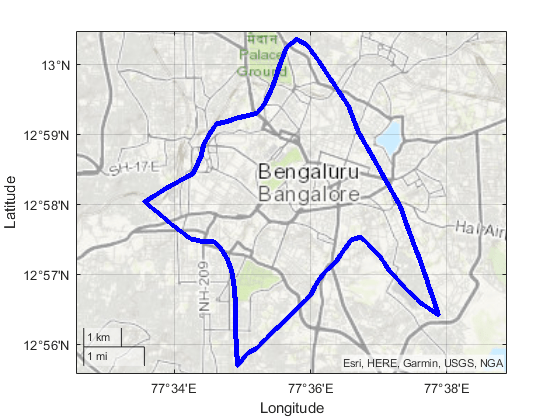
Plot Location by Reading NMEA Sentences Stored in a Log file
This section shows how to read GNSS receiver data in NMEA format logged in a text file, parse the raw data to get the location information, and plot the location obtained in the map. The latitude and longitude used to plot the location can be obtained from multiple NMEA sentences. In this section, we are using GGA sentence to extract latitude and longitude.
Open the log file included with this example and read the data from the file.
% Opens the file gpsLog.txt with read access.
fileID = fopen('gpsLog.txt','r');
% Read the text file.
gpsData = fscanf(fileID,'%c');
Create nmeaParser object by specifying the message ID as GGA. Use the nmeaParser object to parse the data read from the log file.
parserObj = nmeaParser('MessageId','GGA');
% Parse the NMEA Data.
ggaData = parserObj(gpsData);
Read the location from the parsed value and plot the location in the map to see the path travelled by the GNSS receiver.
% Initialize variables.
latVector = zeros(1,numel(ggaData));
lonVector = zeros(1,numel(ggaData));
for i=1:length(ggaData)
    % Check if the parsed GGA sentences are valid and if they are valid, get the
    % latitude and longitude from the output structures. Status = 0,
    % indicates the data is valid
    if ggaData(i).Status == 0
        latVector(i) = ggaData(i).Latitude;
        lonVector(i) = ggaData(i).Longitude;
    end
end
% Remove Nan value in latitude and longitude data, if any nmeaParser object
% returns NaN for a value if the value is not available in the sentence.
% For example, latitude and longitude data are not available if there is no
% satellite fix.
latVector = latVector(~isnan(latVector));
lonVector = lonVector(~isnan(lonVector));

% Plot the position in geographic coordinates
geoplot(latVector,lonVector,'Marker',"*",'MarkerSize',3, ...
    "Color",'blue','MarkerFaceColor','red');
% Selects the basemap
geobasemap 'topographic';
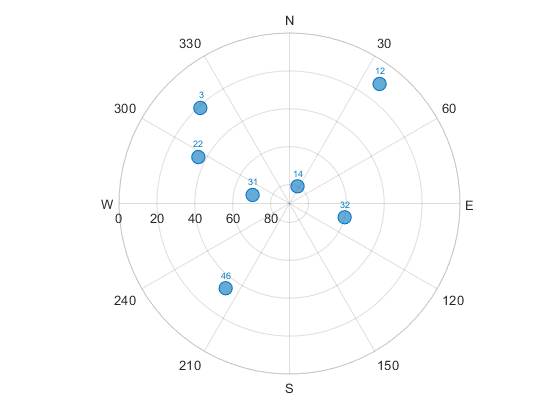
Plot Satellite Position Using skyplot
In this section, you read the satellite position information from the GSV sentences stored in an NMEA log file and plot the azimuth and elevation data using skyplot.
Open the log file included with this example and read the data from the file.
% Opens the file gpsLog.txt with read access
fileID = fopen('gpsLog2.txt','r');
% Read the text file
gpsData = fscanf(fileID,'%c');
Create nmeaParser object specifying the message ID as GSV. Use the nmeaParser object to parse the data read from the log file.
parserObj = nmeaParser('MessageId','GSV');
% Parse the NMEA Data
gsvData = parserObj(gpsData);
Read the azimuth and elevation from the parsed data and plot the satellite position using skyplot. The complete satellite information might be available in multiple GSV sentences. In this section, we are combining all satellite information per cycle before plotting them.
az = []; el = []; satID = []; prevSentenceNumber = 0;
% Create an empty skyplot
sp = skyplot([], [],[]);
for dataCount = 1:numel(gsvData)
    % The complete satellite information for the GPS frame might be
    % available in multiple GSV sentences. The various fields in the GSV
    % sentence can be used to combine the information into a single frame.
    % In this example, we use sentence number and number of satellites in
    % view to combine the information. The SentenceNumber of the GSV data
    % is expected to be sequential for a given frame of GPS data and total
    % number of azimuth and elevation data should be equal to satellites
    % in view.
    if gsvData(dataCount).SentenceNumber == prevSentenceNumber + 1
        az = [az, gsvData(dataCount).Azimuth];
        el = [el, gsvData(dataCount).Elevation];
        satID = [satID, gsvData(dataCount).SatelliteID];
        prevSentenceNumber = gsvData(dataCount).SentenceNumber;
        satellitesinView = gsvData(dataCount).SatellitesInView;
        % Once all the satellite information in a GPS frame is obtained,
        % plot the  satellite position using skyplot
        if numel(az) == satellitesinView && numel(el) == satellitesinView
            set(sp, 'AzimuthData', az, 'ElevationData', el,'LabelData', satID);
            drawnow;
            az = []; el = []; satID = []; prevSentenceNumber = 0;
            % The pause is just to see the satellite position changes in
            % the plot
            pause(2);
        end
    else
        az = []; el = []; satID = []; prevSentenceNumber = 0;
    end
end