Motor Characteristic Analyzer
Description
The Motor Characteristic Analyzer app enables you to interactively analyze motor characteristics of Permanent Magnet Synchronous Motor (PMSM) using MATLAB® plots and also interactively analyze constraint curves. With the app, you can specify motor parameters (lumped motor and inverter parameters, and non-linear parameters) and inverter rating, and then visualize the characteristics to find out the correct motor-inverter pair that is suitable for a certain application. The app provides template datasets of few motors to help you get started on analyzing the characteristics. You can also create your own datasets, change the parameters, and customize the display of characteristic plots and constraint curves.
Using the Motor Characteristic Analyzer app, you can:
Compare drive characteristics and constraint curves for multiple motors in a single plot
Change the motor parameters and inverter rating used for analysis, and find out the maximum operating speed of the motor for a given load torque
Select a field weakening control method (VCLMT, CCCP or CVCP) and compare the speed
Plot non-linear surface curves for comparison
Import motor dataset from a MAT-file to start comparing the characteristics
Find out specific operating points (for example, corner speed, maximum speed, and so on), and evaluate if the operating point is in specific region on the plots
Observe how performance is changing based on change in any of the motor or inverter parameters
Save and restore app sessions for seamless analysis anytime
Export the displayed plot characteristics as a MAT-file
Available Motor Characteristics
The Motor Characteristic Analyzer app allows you to specify the PMSM and
inverter parameters, and the field-weakening control method, in the
Parameters pane of the app, for multiple motors (datasets). To
visualize the characteristics, you can then select different type of plots in the
Analyze section of the app toolstrip by clicking the
corresponding ![]() icons.
icons.
![]()
You can select these type of plots, which will then be displayed under multiple tabs:
Torque-Speed
Power-Speed
Idq-Speed
Ipeak-Speed
Custom — Customize the two axes of the plot to perform your analysis. You can select the characteristics to be represented in either axes (Torque, Power, Speed, Id, Iq, and Ipeak).
Constraint — Identify optimal operating points by selecting any of these constraint curves to be plotted: Current Limit, Voltage Limit, Load Torque, Maximum Torque Per Ampere (MTPA), and Maximum Torque Per Voltage (MTPV).
For plotting the constraint curves, the app assumes space vector modulation (SVM) as the modulation method being used.
Ld-Vs-Idq surface curve
Lq-Vs-Idq surface curve
FluxPM-Vs-Idq surface curve
FluxD-Vs-Idq surface curve
FluxD-Vs-Idq surface curve
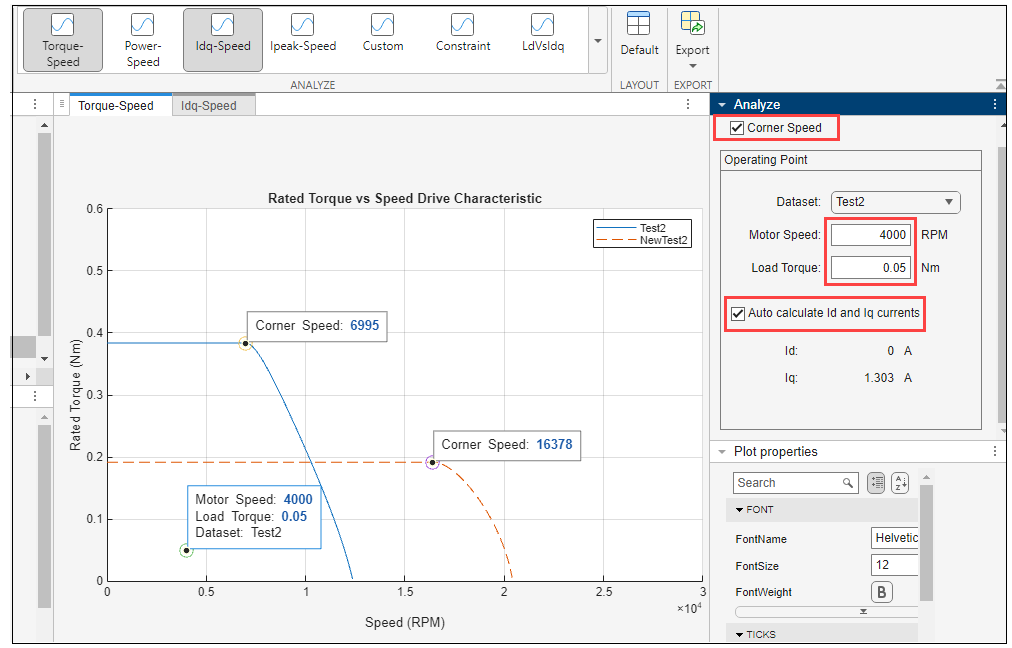
The display of each of these characteristics can further be improvised. For example, for the Torque-Speed characteristics, you can specify the options to display the intended operating point, the corner speed (rated speed) of the selected motor, or the Id, Iq currents.
Note
The assumed modulation method used for plotting the constraint curves is
Open the Motor Characteristic Analyzer App
The Motor Characteristic Analyzer app is launched from inside the Motor Hardware Configurator app or the Motor Parameter Estimator app.
Simulink® Toolstrip: On the Apps tab, under the Setup to Run on Hardware group, click the Motor Hardware Configurator app icon to launch the app. Go to Motor Control Apps panel in the app and click Motor Characteristic Analyzer icon.
Simulink Toolstrip: On the Apps tab, under the Setup to Run on Hardware group, click the Motor Parameter Estimator app icon to launch the app. Go to Motor Control Apps panel in the app and click Motor Characteristic Analyzer icon.
Examples
The Motor Characteristic Analyzer app includes the following template datasets for few motors:
ANAHEIM-BLY171D-24VANAHEIM-BLY172S-24VTEKNIC-M2310P-24VADLEE-BM-180-24VRTML-001-96V
The following procedure shows how to plot different drive characteristics for
TEKNIC-M2310P-24V.
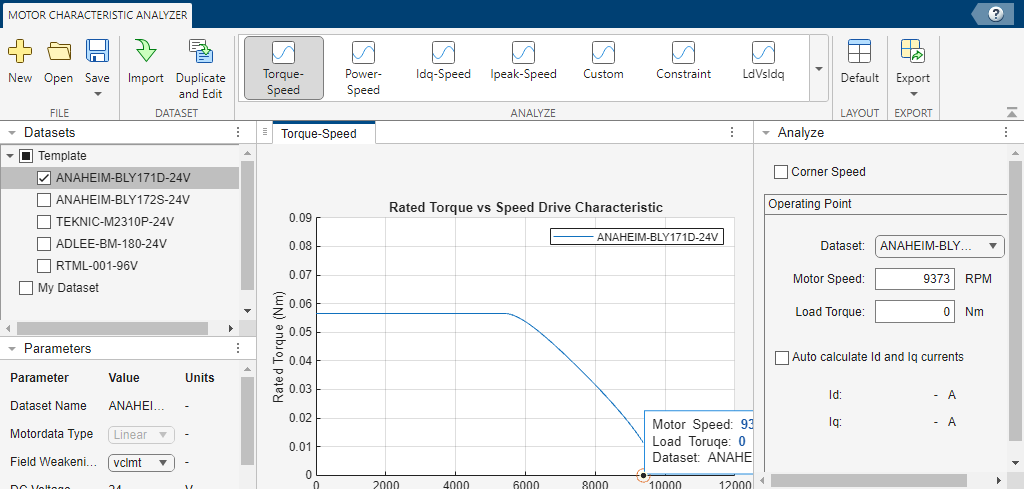
Select the
TEKNIC-M2310P-24Vtemplate on the left pane.Click the Torque-Speed icon, available in the Analyze section of the app toolstrip.
The plot for
Rated Torque vs Speed Drive characteristicappears in the center pane.In the Parameters pane, the default value for Field Weakening Control is
vclmt. Change this value tocccp. You can observe that the app refreshes to display a different plot according to the new Field Weakening Control option.Click the Idq-Speed icon, available in the Analyze section of the app toolstrip.
A new plot
Id and Iq vs Speed Drive Characteristicappears in a new pane Idq-Speed. You also notice that the previous analysis of Torque-Speed characteristic is still available in the previous tab.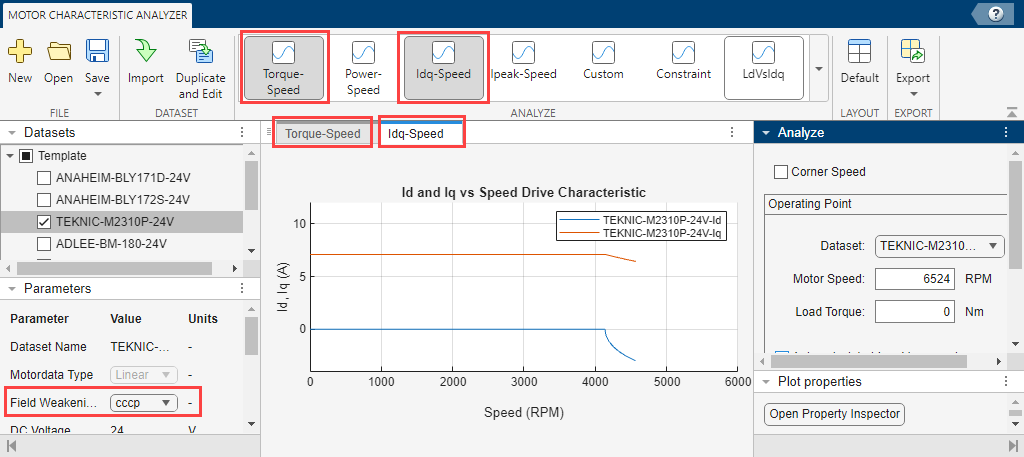
The following procedure shows how to plot constraint curves for
TEKNIC-M2310P-24V.
Select the
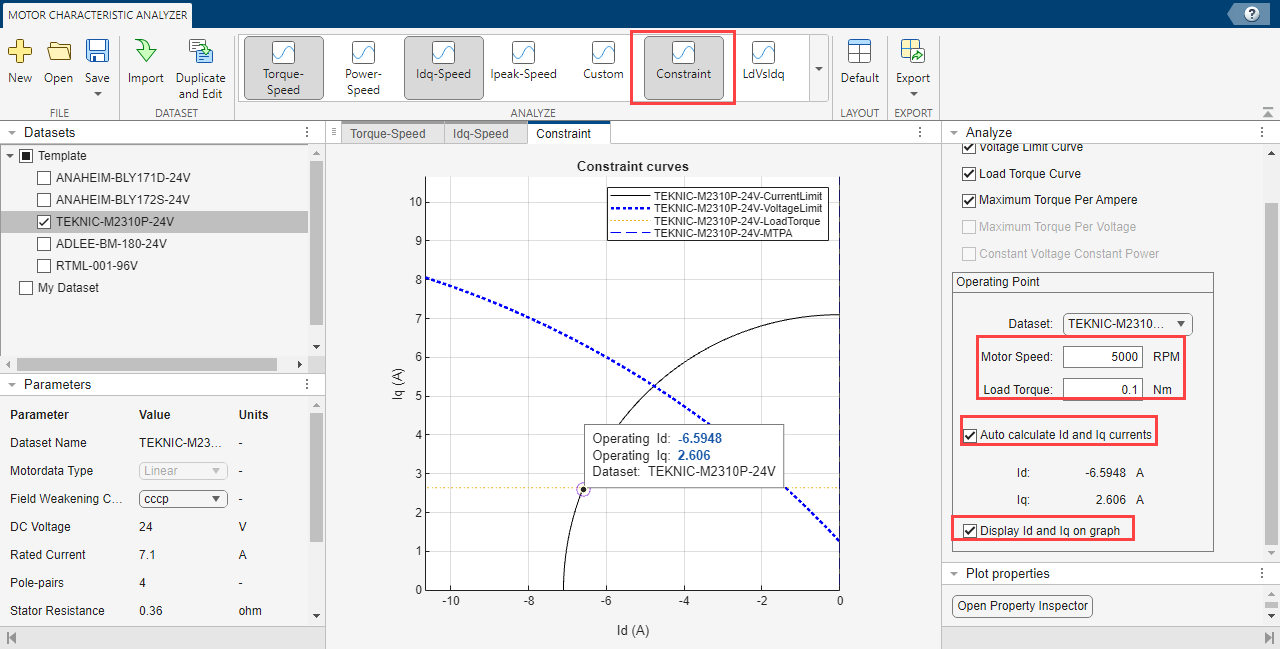
TEKNIC-M2310P-24Vtemplate on the left pane.Click the Constraint icon, available in the Analyze section of the app toolstrip.
The plot for
Constraint curves(Id-Iq reference frame) appears in the center pane.In the Operating Point area under the Analyze pane on the right, change the value of Motor Speed to
5000RPM and the value of Load Torque to0.1Nm. You can observe that the app refreshes to display the changed constraint curve according to the new values.Select the Auto calculate Id and Iq currents option. The actual value of Id and Iq current gets displayed.
Select Display Id and Iq on graph option. The Constraint curves graph gets updated to show the exact operating point.
The Motor Characteristic Analyzer app also enables you to import a dataset (MAT-file) and compare the characteristics with an existing template.
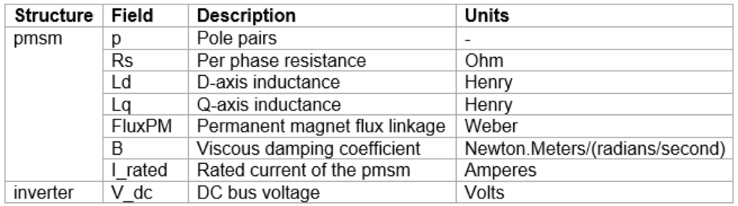
The motor data to be imported must conform to the standard structure of PMSM
properties that Motor Control Blockset supports (pmsm and
inverter variables). The structure in MAT-file can contain
these fields (which are same as the ones displayed under the
Parameters pane in the app after importing):
The following procedure shows how to import a dataset and compare its
characteristics with TEKNIC-M2310P-24V template.
Click Import icon on the app toolstrip.
Enter a name for the dataset (for example,
Imported1) and click OK.The new dataset appears under My Dataset in the Datasets pane.
Select the imported dataset and the
TEKNIC-M2310P-24Vtemplate with which you want to compare the characteristics. The plot gets refreshed and shows a comparison of the characteristics.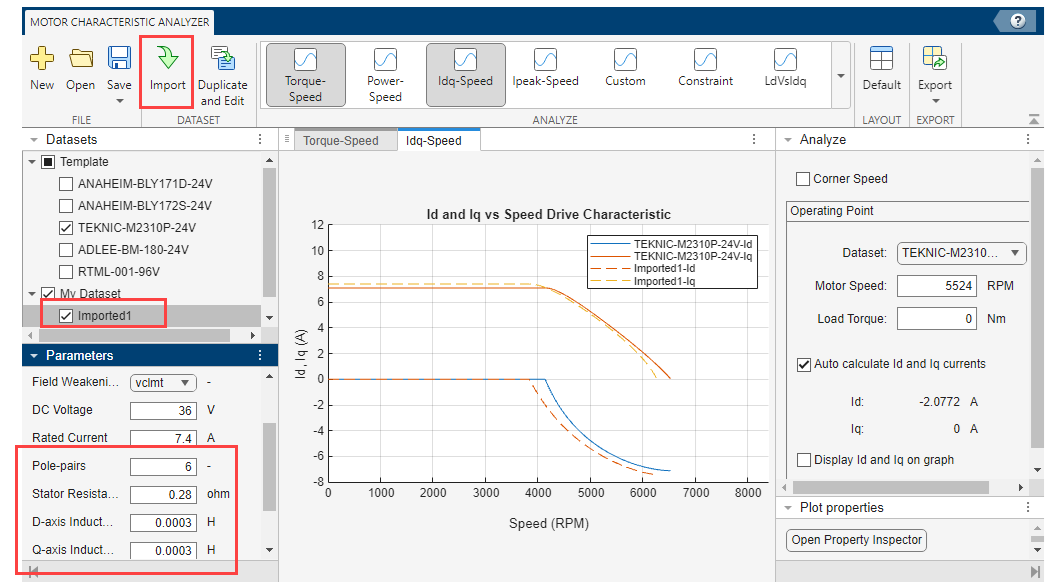
Note
You can select multiple datasets also (more than two) to view and compare the characteristics.
The Motor Characteristic Analyzer app also enables you to create a duplicate copy (custom dataset) based on an existing template, edit the parameters DC voltage and Rated Current, and compare the characteristics.
Note
The procedure that uses Duplicate and Edit option, as described in this section, must not be used for comparing the characteristics by editing the PMSM properties like pole-pairs, inductance, resistance, and so on, in the Parameters pane. For comparing characteristics based on those PMSM properties, import a modified dataset separately. For details, see Import Dataset and Compare Motor Characteristics.
The following procedure shows how to work with custom dataset based on
TEKNIC-M2310P-24V.
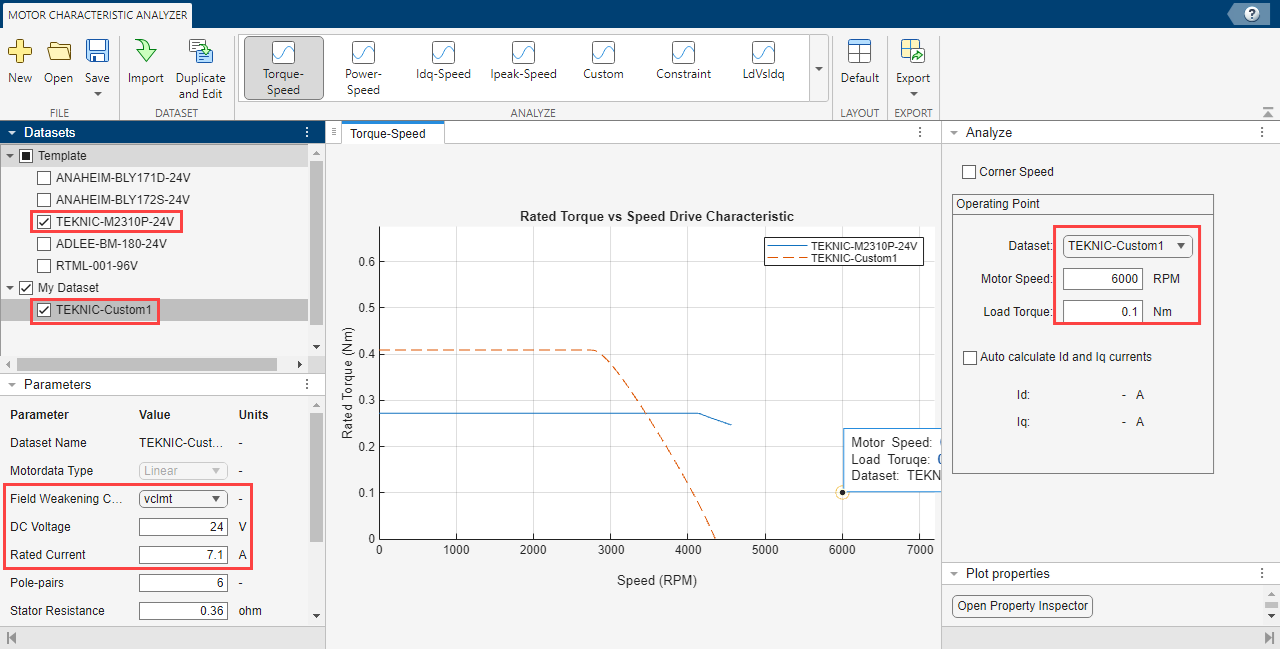
Select the
TEKNIC-M2310P-24Vtemplate on the left pane.Click Duplicate and Edit icon on the app toolstrip.
Enter a name for the custom dataset (for example,
TEKNIC-Custom1) and click OK.The new dataset appears under My Dataset in the Datasets pane.
Select the dataset and edit the values for DC voltage and Rated Current parameters, and optionally select a different Field Weakening Control method.
Select both the template and the custom dataset to view the updated plot and compare the characteristics:
Note
You can select multiple datasets also (more than two) to view and compare the characteristics.
The Motor Characteristic Analyzer app enables you to save the data associated with an app session to a MAT file as well as use this file to restore a session.
By default, the app uses a temporary storage to save the current session data. However, this data is lost when you close the app. To avoid such data losses, the app enables you to save the following session information in a MAT file:
Most recent status of various fields
Custom datasets
Operating point values
Clicking either Save or Save As options automatically saves the preceding session data in the app temporary storage. However, the following procedure shows how to save this data to a MAT file as well as use the file to restore a saved session:
Anytime while using an unsaved app session, click Save > Save As (or the Save option) to launch the Select File to Write window.
Enter a name for the session data MAT file and save the file to a folder of your choice. You can also replace an existing session data MAT-file.
After you save the session data once, you can directly use the Save option to update the session data to the last saved file.
To create a new session, click New > Session from the app toolstrip.
To restore a saved session, click the Open button in the app toolstrip to launch the Select File to Open window. Locate and select the session data MAT-file. Click Open to close the previously open session and restore the saved session from the MAT-file.
After you restore a session, clicking the Save option updates session data to the same MAT file that you used to restore the session. Use Save As option to save session data to a different file.
The Motor Characteristic Analyzer app enables you to export data for the dataset that you have currently highlighted in the Datasets pane, into a MAT-file. The three options to export result data are:
Export result data– Exports all the data of the highlighted dataset, displayed in the app, including the setting of operating points and the values of parameters into a MAT-file.Export Idqref lookup table– The app generates the lookup table (LUT) of the data based on the current setting of parameters and operating points of the highlighted dataset, and saves this data to a MAT-file.Generate model– The app generates a Simulink model the uses the highlighted dataset, parameter values, and operating points. This model contains the controller and plant model.
The following procedure shows how to export a custom dataset.
Select the custom dataset to highlight it.
Note
The Export action always corresponds to the highlighted dataset, even if you have selected other datasets (using checkbox). The highlighted dataset can be under Template or My Dataset.
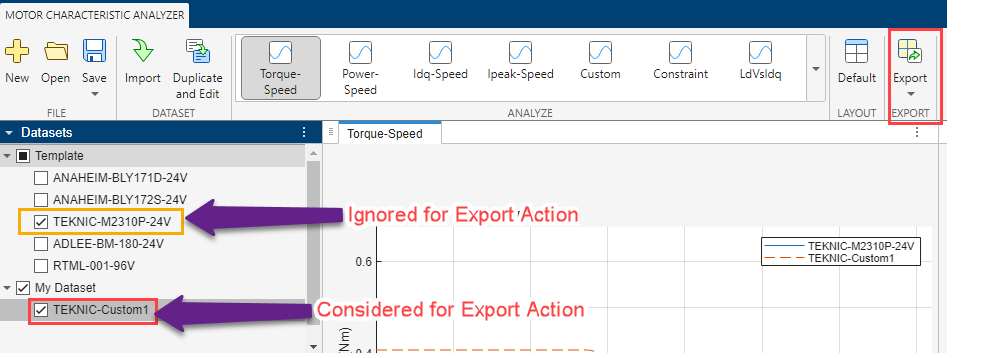
On the app toolstrip, click Export and then one of three options to export.
Enter a name for the file and click OK.
Related Examples
Version History
Introduced in R2025a