text
Add text descriptions to data points
Description
text(___, specifies Name,Value)Text object
properties using one or more name-value pairs. For example, 'FontSize',14 sets
the font size to 14 points. You can specify text properties with any
of the input argument combinations in the previous syntaxes. If you
specify the Position and String properties
as name-value pairs, then you do not need to specify the x, y, z,
and txt inputs.
text( creates the text in the
Cartesian, polar, or geographic axes specified by ax,___)ax instead
of in the current axes (gca). The option
ax can precede any of the input argument combinations in
the previous syntaxes.
t = text(___)t to modify properties
of the text objects after they are created. For a list of properties
and descriptions, see Text Properties.
You can specify an output with any of the previous syntaxes.
Examples
Plot a sine curve. At the point , add the text description . Use the TeX markup \pi for the Greek letter . Use \leftarrow to display a left-pointing arrow.
x = 0:pi/20:2*pi;
y = sin(x);
plot(x,y)
text(pi,0,'\leftarrow sin(\pi)')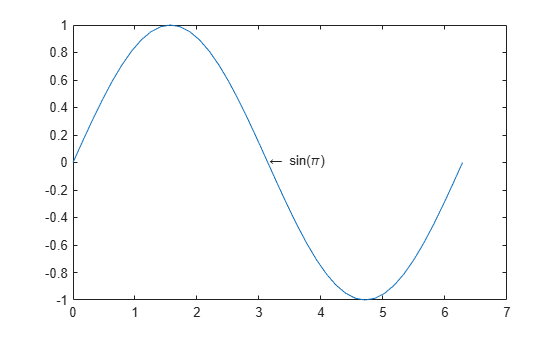
For a list of Greek characters and other TeX markup, see the Interpreter property description.
Plot a line. Add the same text to two points along the line.
x = linspace(-5,5);
y = x.^3-12*x;
plot(x,y)

xt = [-2 2];
yt = [16 -16];
str = 'dy/dx = 0';
text(xt,yt,str)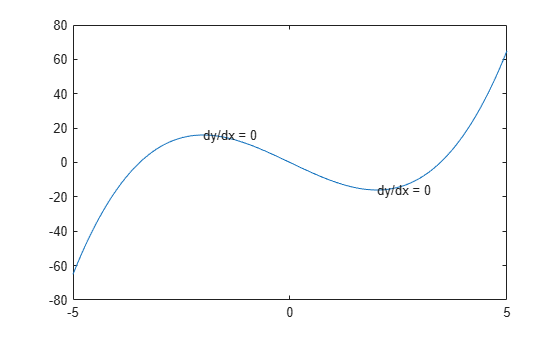
Add different text to each point by specifying str as a cell array.
x = linspace(-5,5);
y = x.^3-12*x;
plot(x,y)

xt = [-2 2];
yt = [16 -16];
str = {'local max','local min'};
text(xt,yt,str)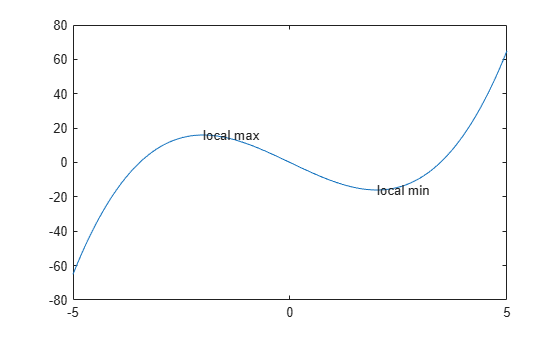
Create a line plot and add one text description to the axes. Display multiline text by specifying str as a cell array.
plot(1:10)
str = {'A simple plot','from 1 to 10'};
text(2,7,str)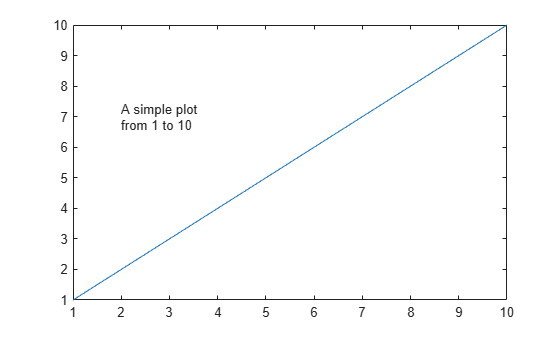
Create a line plot and add two text descriptions to the axes. When adding multiple text descriptions to the axes, display multiline text by specifying nested cell arrays.
plot(1:10)
str = {{'A simple plot','from 1 to 10'},'y = x'};
text([2 8],[7 7],str)
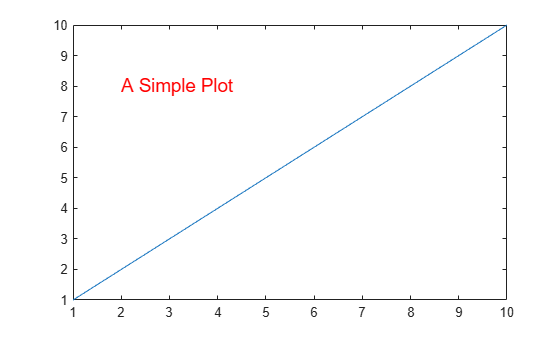
Create a line plot and add a text description to the axes. Use red, size 14 font.
plot(1:10)
text(2,8,'A Simple Plot','Color','red','FontSize',14)
Create a line plot and add two text descriptions along the line. Return the text objects, t.
x = linspace(-5,5);
y = x.^3-12*x;
plot(x,y)
t = text([-2 2],[16 -16],'dy/dx = 0')
t =
  2×1 Text array:

  Text    (dy/dx = 0)
  Text    (dy/dx = 0)
The text function creates one text object for each text description. Thus, t contains two text objects.
Change the color and font size for the first text object using t(1). Use dot notation to set properties. If you are using an earlier release, use the set function instead.
t(1).Color = 'red';
t(1).FontSize = 14;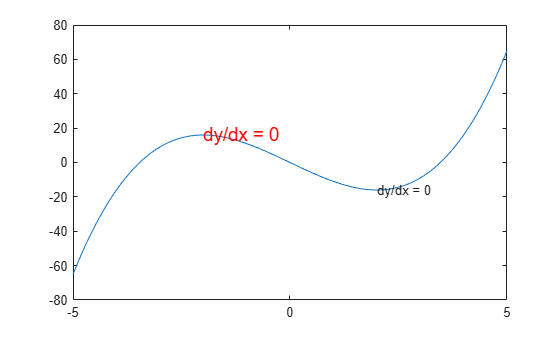
Use the AffectAutoLimits property to include the anchor point of the Text object in the axes limits. Setting this property can help you to locate and fine-tune the position of your text.
Create a plot of a sine wave.
x = 0:0.1:10;
y = sin(x);
plot(x,y)

Create a text object outside of the current y-axis limits. Set the AffectAutoLimits property to "on" so that the axes limits adjust to include the anchor point of the text.
text(1.1,1.1,"Peak",AffectAutoLimits="on")

Input Arguments
Name-Value Arguments
Specify optional pairs of arguments as
Name1=Value1,...,NameN=ValueN, where Name is
the argument name and Value is the corresponding value.
Name-value arguments must appear after other arguments, but the order of the
pairs does not matter.
Before R2021a, use commas to separate each name and value, and enclose
Name in quotes.
Example: text(.5,.5,'my text','FontSize',14,'Color','red')
Note
The properties listed here are only a subset. For a full list, see Text Properties.
Alternatively, you can specify some common colors by name. This table lists the named color options, the equivalent RGB triplets, and the hexadecimal color codes.
| Color Name | Short Name | RGB Triplet | Hexadecimal Color Code | Appearance |
|---|---|---|---|---|
"red" | "r" | [1 0 0] | "#FF0000" |
|
"green" | "g" | [0 1 0] | "#00FF00" |
|
"blue" | "b" | [0 0 1] | "#0000FF" |
|
"cyan"
| "c" | [0 1 1] | "#00FFFF" |
|
"magenta" | "m" | [1 0 1] | "#FF00FF" |
|
"yellow" | "y" | [1 1 0] | "#FFFF00" |
|
"black" | "k" | [0 0 0] | "#000000" |
|
"white" | "w" | [1 1 1] | "#FFFFFF" |
|
"none" | Not applicable | Not applicable | Not applicable | No color |
This table lists the default color palettes for plots in the light and dark themes.
| Palette | Palette Colors |
|---|---|
Before R2025a: Most plots use these colors by default. |
|
|
|
You can get the RGB triplets and hexadecimal color codes for these palettes using the orderedcolors and rgb2hex functions. For example, get the RGB triplets for the "gem" palette and convert them to hexadecimal color codes.
RGB = orderedcolors("gem");
H = rgb2hex(RGB);
Before R2023b: Get the RGB triplets using RGB =
get(groot,"FactoryAxesColorOrder").
Before R2024a: Get the hexadecimal color codes using H =
compose("#%02X%02X%02X",round(RGB*255)).
Example: 'blue'
Example: [0
0 1]
Example: '#0000FF'
Horizontal alignment of the text with respect to the x value
in the Position property, specified as one of the
values in this table. The vertical line indicates where the x value
lies in relation to the text.
| Value | Result |
|---|---|
'left' (default) |
|
'center' |
|
'right' |
|
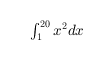
LaTeX Markup
To use LaTeX markup, set the interpreter to "latex". For inline
mode, surround the markup with single dollar signs ($). For
display mode, surround the markup with double dollar signs
($$).
| LaTeX Mode | Example | Result |
|---|---|---|
| Inline |
"$\int_1^{20} x^2 dx$" |
|
| Display |
"$$\int_1^{20} x^2 dx$$" |
|

The displayed text uses the default LaTeX font style. The
FontName, FontWeight, and
FontAngle properties do not have an effect. To change the
font style, use LaTeX markup.
The maximum size of the text that you can use with the LaTeX interpreter is 1200 characters. For multiline text, this reduces by about 10 characters per line.
MATLAB supports most standard LaTeX math mode commands. For more information, see Supported LaTeX Commands. For examples that use TeX and LaTeX, see Greek Letters and Special Characters in Chart Text.
Output Arguments
Tips
By default, the
Clippingproperty for text objects is set to"off"so the text might appear outside the axes. To clip the text to the axes boundaries, set the property to"on".The words
"default","remove", and"factory"are reserved words in MATLAB. To create text using one of these words, append a backslash (\) before the word; for example,text(.5,.5,"\default").
Version History
Introduced before R2006a