Line
Line annotation on figure
Description
Draw a line annotation anywhere on a figure. Set properties of a
Line object to control its appearance.
Creation
Create a line annotation on a figure using the annotation function.
annotation("line") Alternatively, create a line annotation by clicking the figure and selecting Line in the gallery on the Figure tab.
Properties
Color and Styling
Line color, specified as an RGB triplet, a hexadecimal color code, a color name,
or a short name. The default value of [0 0 0] corresponds to
black.
For a custom color, specify an RGB triplet or a hexadecimal color code.
An RGB triplet is a three-element row vector whose elements specify the intensities of the red, green, and blue components of the color. The intensities must be in the range
[0,1], for example,[0.4 0.6 0.7].A hexadecimal color code is a string scalar or character vector that starts with a hash symbol (
#) followed by three or six hexadecimal digits, which can range from0toF. The values are not case sensitive. Therefore, the color codes"#FF8800","#ff8800","#F80", and"#f80"are equivalent.
Alternatively, you can specify some common colors by name. This table lists the named color options, the equivalent RGB triplets, and the hexadecimal color codes.
| Color Name | Short Name | RGB Triplet | Hexadecimal Color Code | Appearance |
|---|---|---|---|---|
"red" | "r" | [1 0 0] | "#FF0000" |
|
"green" | "g" | [0 1 0] | "#00FF00" |
|
"blue" | "b" | [0 0 1] | "#0000FF" |
|
"cyan"
| "c" | [0 1 1] | "#00FFFF" |
|
"magenta" | "m" | [1 0 1] | "#FF00FF" |
|
"yellow" | "y" | [1 1 0] | "#FFFF00" |
|
"black" | "k" | [0 0 0] | "#000000" |
|
"white" | "w" | [1 1 1] | "#FFFFFF" |
|
"none" | Not applicable | Not applicable | Not applicable | No color |
This table lists the default color palettes for plots in the light and dark themes.
| Palette | Palette Colors |
|---|---|
Before R2025a: Most plots use these colors by default. |
|
|
|
You can get the RGB triplets and hexadecimal color codes for these palettes using the orderedcolors and rgb2hex functions. For example, get the RGB triplets for the "gem" palette and convert them to hexadecimal color codes.
RGB = orderedcolors("gem");
H = rgb2hex(RGB);
Before R2023b: Get the RGB triplets using RGB =
get(groot,"FactoryAxesColorOrder").
Before R2024a: Get the hexadecimal color codes using H =
compose("#%02X%02X%02X",round(RGB*255)).
Example: "blue"
Example: [0 0 1]
Example: "#0000FF"
Line style, specified as one of the options listed in this table.
| Line Style | Description | Resulting Line |
|---|---|---|
"-" | Solid line |
|
"--" | Dashed line |
|
":" | Dotted line |
|
"-." | Dash-dotted line |
|
"none" | No line | No line |
Line width, specified as a positive value in point units. One point equals 1/72 inch.
Example: 0.75
Position
Beginning and ending x-coordinates, specified as a
two-element vector of the form [x_begin x_end].
By default, the units are normalized to the figure. The lower-left corner of the
figure maps to (0,0) and the upper-right corner maps to
(1,1). To change the units, use the Units
property.
Example: [0.2 0.3]
Beginning and ending y-coordinates, specified as a
two-element vector of the form [y_begin y_end].
By default, the units are normalized to the figure. The lower-left corner of the
figure maps to (0,0) and the upper-right corner maps to
(1,1). To change the units, use the Units
property.
Example: [0.2 0.3]
Size and location, specified as a four-element vector of the form
[x_begin y_begin dx dy]. The first two elements specify the
coordinates of the starting point of the line. The second two elements specify the
slope of the line.
By default, the units are normalized to the figure. The lower-left corner of the
figure maps to (0,0) and the upper-right corner maps to
(1,1). To change the units, use the Units
property. To change the units, use the Units property.
Example: [0.2 0.2 0.3 0.3]
Examples
Create a line annotation on a figure. Specify the horizontal range of the line using the form [x_begin x_end] and vertical range of the line using the form [y_begin y_end]. By default, the units are normalized to the figure. So, the lower-left corner of the figure maps to (0,0) and the upper-right corner maps to (1,1).
x = linspace(0,2);
y = x.^2;
plot(x,y)

xint = [0.36 0.89];
yint = [0.13 0.74];
annotation("line",xint,yint);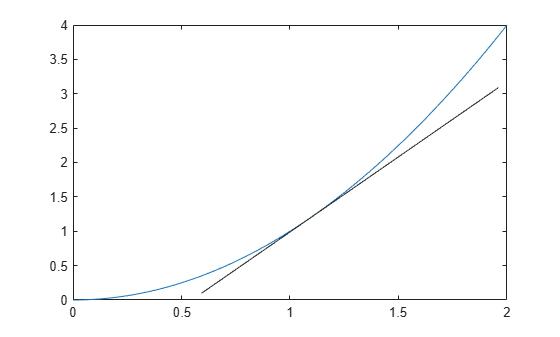
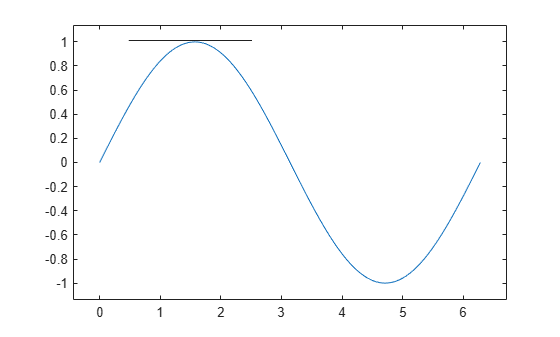
Create a line annotation on a figure.
x = linspace(0,2*pi);
y = sin(x);
plot(x,y)
axis padded

xint = [0.23 0.45];
yint = [0.88 0.88];
an = annotation("line",xint,yint);
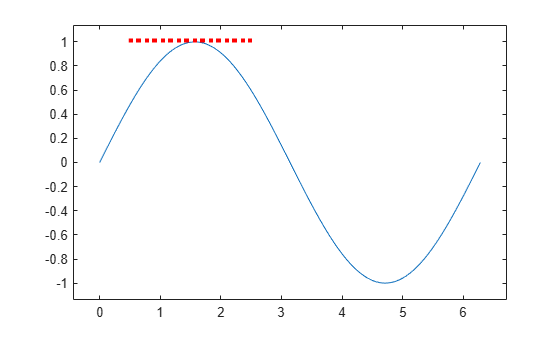
Customize the line annotation by setting the line width, line color, and line style.
an.LineWidth = 3;
an.Color = "r";
an.LineStyle = ":";
Create two line annotations on a figure.
x = linspace(0,4);
y = x.^2;
plot(x,y)

xint1 = [0.52 0.52];
yint1 = [0.11 0.32];
an1 = annotation("line",xint1,yint1);

xint2 = [0.71 0.71];
yint2 = [0.11 0.57];
an2 = annotation("line",xint2,yint2);
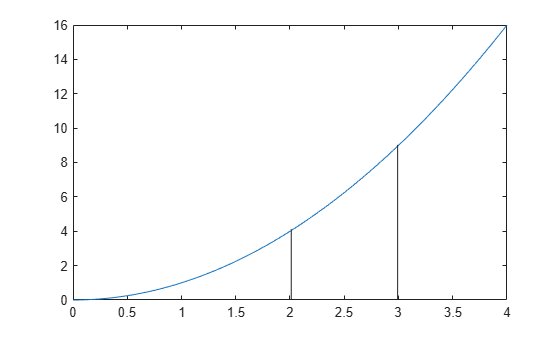
Set the line style of both line annotations to be dashed.
an1.LineStyle = "--";
an2.LineStyle = "--";

Version History
Introduced before R2006a