alphaSpectrum
Alpha values giving distinct alpha shapes
Syntax
Description
a = alphaSpectrum(shp)a is in descending sorted order. Each element in
a represents a value of the alpha radius that results in a
distinct shape. The length of a is equal to the number of unique
shapes. Values of alpha that lie between the values in a do not
produce unique alpha shapes.
Examples
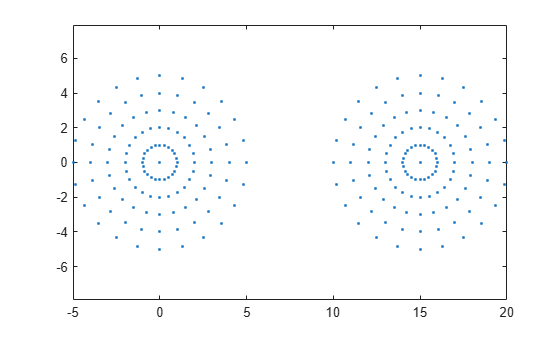
Create and plot a set of 2-D points.
th = (pi/12:pi/12:2*pi)';
x1 = [reshape(cos(th)*(1:5), ...
      numel(cos(th)*(1:5)),1);
      0];
y1 = [reshape(sin(th)*(1:5), ...
      numel(sin(th)*(1:5)),1);
      0];
x = [x1;x1+15;];
y = [y1;y1];
plot(x,y,".")
axis equal
Create an alpha shape for the point cloud using the default alpha radius.
shp = alphaShape(x,y);
Find the spectrum of critical alpha values that produce unique alpha shapes for the point cloud.
alphaspec = alphaSpectrum(shp);
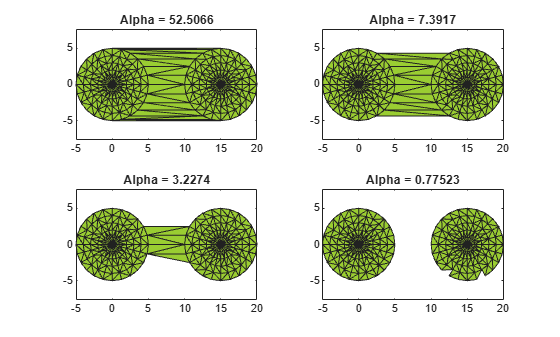
Plot four of the unique alpha shapes generated by alpha values in the spectrum.
for k = 1:4
    alpha = alphaspec(8*k-7);
    shp.Alpha = alpha;
    subplot(2,2,k)
    plot(shp)
    title("Alpha = "+alpha)
end
Input Arguments
Output Arguments
Version History
Introduced in R2014b