Label Contour Plot Levels
This example shows how to label each contour line with its associated value.
The contour matrix, C, is an optional output argument returned by contour, contour3, and contourf. The clabel function uses values from C to display labels for 2-D contour lines.
Display eight contour levels of the peaks function and label the contours. clabel labels only contour lines that are large enough to contain an inline label.
Z = peaks;
figure
[C,h] = contour(Z,8);

clabel(C,h)
title('Contours Labeled Using clabel(C,h)')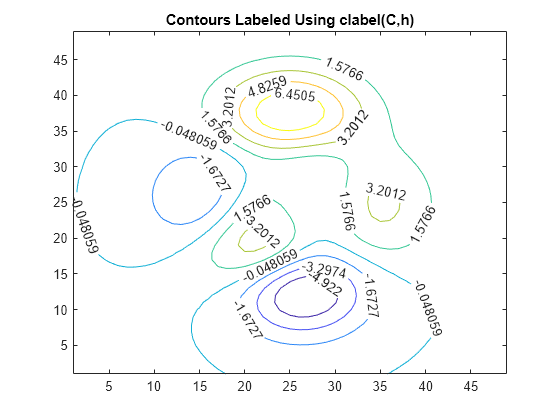
To interactively select the contours to label using the mouse, pass the manual option to clabel, for example, clabel(C,h,'manual'). This command displays a crosshair cursor when the mouse is within the figure. Click the mouse to label the contour line closest to the cursor.