mapshow
Display map data without projection
Syntax
Description
mapshow(
displays the coordinate vectors x,y)x and
y as lines. You can optionally display the coordinate
vectors as points or polygons by using the DisplayType
name-value pair argument.
mapshow( displays the vector
geographic features stored in S)S as points, multipoints,
lines, multilines, polygons, or multipolygons according to the geometry of
S.
You can optionally specify symbolization rules using the
SymbolSpec name-value pair argument.
mapshow(
displays a geolocated data grid, x,y,Z)Z. You can optionally
display the data as a surface, mesh, texture map, or contour by using the
DisplayType name-value pair argument.
mapshow(
displays a regular data grid, Z,R)Z, with referencing object
R. You can optionally display the data as a surface,
mesh, texture map, or contour by using the DisplayType
name-value pair argument. If DisplayType is
'texturemap', then mapshow displays
the image as a texture map on a zero-elevation surface (by setting
ZData values to 0).
mapshow(
display a geolocated image as a texture map on a zero-elevation surface. The
geolocated image can be a truecolor, grayscale, or binary image,
x,y,X,cmap)I, or an indexed image X with
colormap cmap. x and
y are geolocation arrays in map coordinates. Examples
of geolocated images include a color composite from a satellite swath or an
image originally referenced to a different coordinate system.
mapshow( displays data from
the file specified according to the type of file format.filename)
mapshow(___,
modifies the displayed map by using name-value pair arguments to set the
Name,Value)DisplayType and SymbolSpec
parameters. You can also use name-value pairs to set any MATLAB® graphics properties. Parameter names can be abbreviated, and case
does not matter.
mapshow( sets the
parent axes to ax,___)ax.
h = mapshow(___)
Examples
Overlay Boston roads on an orthophoto. Note that mapshow draws a new layer in the axes rather than replacing its contents.
Display image.
figure
mapshow boston.tif
axis image off manual

Convert Boston roads to units of survey feet and overlay on orthophoto.
S = shaperead('boston_roads.shp');
surveyFeetPerMeter = unitsratio('sf','meter');
x = surveyFeetPerMeter * [S.X];
y = surveyFeetPerMeter * [S.Y];
mapshow(x,y)

Import a shapefile containing a network of road segments in Concord, MA as a geospatial table. Display the road segments using dotted lines.
roads = readgeotable("boston_roads.shp");
figure
mapshow(roads,"LineStyle",":")

Create a symbol specification to distinguish between different types of roads. For example, you can hide very minor roads (CLASS=6) by turning off their visibility and make major roads (CLASS=1-4) more visible by increasing their line widths. This symbol specification also uses color to distinguish between types of roads.
roadspec = makesymbolspec('Line',...
                          {'ADMIN_TYPE',0,'Color','cyan'}, ...
                          {'ADMIN_TYPE',3,'Color','red'},...
                          {'CLASS',6,'Visible','off'},...
                          {'CLASS',[1 4],'LineWidth',2});
Display the vector data using the symbol specification.
figure
mapshow('boston_roads.shp','SymbolSpec',roadspec);

Create a symbol specification and specify the default color used for lines. As seen in the previous example, the default is blue. This example sets the default to black.
roadspec = makesymbolspec('Line',...
                              {'Default', 'Color', 'black'}, ...
                              {'ADMIN_TYPE',0,'Color','c'}, ...
                              {'ADMIN_TYPE',3,'Color','r'},...
                              {'CLASS',6,'Visible','off'},...
                              {'CLASS',[1 4],'LineWidth',2});
Display the vector data, using the symbol specification. Note how the major roads displayed in blue in the previous example are now black.
figure
mapshow('boston_roads.shp','SymbolSpec',roadspec);

Create a symbol specification, setting various properties.
roadspec = makesymbolspec('Line',...
                              {'Default', 'Color', 'yellow'}, ...
                              {'ADMIN_TYPE',0,'Color','c'}, ...
                              {'ADMIN_TYPE',3,'Color','r'},...
                              {'CLASS',6,'Visible','off'},...
                              {'CLASS',[1 4],'LineWidth',2});
Display the vector data, specifying the color on the command line.
figure
mapshow('boston_roads.shp', 'Color', 'black', 'SymbolSpec', roadspec);

Import an orthophoto of Concord, MA, along with a map cells reference object and a colormap. Display the orthophoto using the mapshow function.
[ortho,R,cmap] = readgeoraster("concord_ortho_w.tif");
mapshow(ortho,cmap,R) 
Import and display a polygon representing a pond in the middle of the orthophoto.
Import a shapefile containing hydrographic data for Concord as a geospatial table. Create a subtable that contains the 14th row of the table, which is the row containing the pond. Verify that the subtable contains polygon data by querying the Shape variable of the table.
hydro = readgeotable("concord_hydro_area.shp");
pond = hydro(14,:);
pond.Shape
ans =
mappolyshape with properties:
NumRegions: 1
NumHoles: 3
Geometry: "polygon"
CoordinateSystemType: "planar"
ProjectedCRS: [1×1 projcrs]
Display the polygon over the orthophoto.
mapshow(pond,"FaceColor","c")

Read SDTS terrain data for Mount Washington. Prepare the data for plotting by specifying the output type as "double".
[Z,R] = readgeoraster("MtWashington-ft.grd",OutputType="double");
View the terrain data as a mesh. Apply a colormap appropriate for terrain data using demcmap.
figure
mapshow(Z,R,DisplayType="mesh")
demcmap(Z)
View the terrain data as a surface.
figure
mapshow(Z,R,DisplayType="surface")
demcmap(Z)
View the terrain data as a 3-D surface.
view(3)
axis normal
Read the terrain data files for Mount Washington and Mount Dartmouth. Prepare the data for plotting by specifying the output type as "double".
[ZWash,RWash] = readgeoraster("MtWashington-ft.grd",OutputType="double");
[ZDart,RDart] = readgeoraster("MountDartmouth-ft.grd",OutputType="double");
Display the terrain data under the contour lines and labels by specifying the ZData name-value argument as a matrix of zeros. Apply a colormap appropriate for terrain data using demcmap.
hold on
mapshow(ZWash,RWash,DisplayType="surface",ZData=zeros(RWash.RasterSize))
mapshow(ZDart,RDart,DisplayType="surface",ZData=zeros(RDart.RasterSize))
axis equal
demcmap(ZWash)

Overlay black contour lines and labels.
mapshow(ZWash,RWash,DisplayType="contour",LineColor="k",ShowText="on")
mapshow(ZDart,RDart,DisplayType="contour",LineColor="k",ShowText="on")

Input Arguments
Name-Value Arguments
Output Arguments
Tips
If you do not want
mapshowto draw on top of an existing map, create a new figure or subplot before calling it.You can use
mapshowto display vector data in anaxesmfigure. However, you should not subsequently change the map projection usingsetm.If you display a polygon, do not set
'EdgeColor'to either'flat'or'interp'. This combination may result in a warning.
Alternative Functionality
The mapshow function displays data on Cartesian axes. To display
data in 2-D using geographic axes or map axes, use these functions instead:
For a comparison of 2-D map display options, including when to use each type of display, see Choose a 2-D Map Display.
Version History
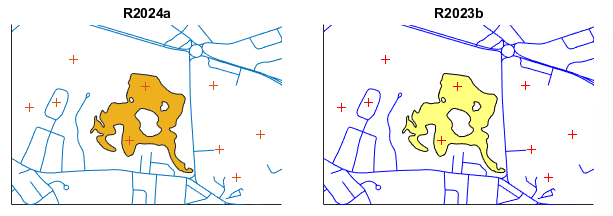
Introduced before R2006aWhen you plot vector data using the mapshow function, the
function uses different default colors. This image compares the default colors of
points, lines, and polygons in R2024a and R2023b.