Main Content

sidsam

Measure spectral similarity using spectral information divergence-spectral angle mapper hybrid method

Since R2020b

    Description

    example

    score = sidsam(inputData,refSpectrum) measures the spectral similarity between the spectrum of each pixel in the hyperspectral data inputData and the specified reference spectrum refSpectrum by using the spectral information divergence-spectral angle mapper (SID-SAM) hybrid method. Use this syntax to identify different regions or materials in a hyperspectral data cube. For information about the SID-SAM method, see Algorithm.

    example

    score = sidsam(testSpectrum,refSpectrum) measures the spectral similarity between the specified test spectrum testSpectrum and reference spectrum refSpectrum by using the SID-SAM hybrid method. Use this syntax to compare the spectral signature of an unknown material against the reference spectrum or to compute spectral variability between two spectral signatures.

    Note

    This function requires the Image Processing Toolbox™ Hyperspectral Imaging Library. You can install the Image Processing Toolbox Hyperspectral Imaging Library from Add-On Explorer. For more information about installing add-ons, see Get and Manage Add-Ons.

    The Image Processing Toolbox Hyperspectral Imaging Library requires desktop MATLAB®, as MATLAB Online™ or MATLAB Mobile™ do not support the library.

    Examples

    collapse all

    Read hyperspectral data into the workspace.

    hcube = hypercube('jasperRidge2_R198.hdr');

    Estimate the number of spectrally distinct endmembers in the data cube by using countEndmembersHFC function.

    numEndmembers = countEndmembersHFC(hcube,'PFA',10^-7);

    Extract the endmember spectral signatures from the data cube by using the NFINDR algorithm.

    endmembers = nfindr(hcube,numEndmembers);

    Plot the spectral signatures of the extracted endmembers.

    figure
    plot(endmembers)
    xlabel('Bands')
    ylabel('Reflectance')
    legend('Location','Bestoutside')

    Compute the SID-SAM distance between each endmember and the spectrum of each pixel in the data cube.

    score = zeros(size(hcube.DataCube,1),size(hcube.DataCube,2),numEndmembers);
    for i = 1:numEndmembers
        score(:,:,i) = sidsam(hcube,endmembers(:,i));
    end

    Compute the minimum score value from the distance scores obtained for each pixel spectrum with respect to all the endmembers. The index of each minimum score identifies the endmember spectrum to which a pixel spectrum exhibits maximum similarity. An index value, n, at the spatial location (x, y) in the score matrix indicates that the spectral signature of the pixel at spatial location (x, y) in the data cube best matches the spectral signature of the nth endmember.

    [~,matchingIdx] = min(score,[],3);

    Estimate an RGB image of the input data by using the colorize function.

    rgbImg = colorize(hcube,'Method','rgb','ContrastStretching',true);

    Display both the RGB image and the matrix of matched index values.

    figure('Position',[0 0 800 400])
    subplot('Position',[0 0.1 0.4 0.8])
    imagesc(rgbImg)
    axis off
    title('RGB Image of Hyperspectral Data')
    subplot('Position',[0.45 0.1 0.45 0.8])
    imagesc(matchingIdx)
    axis off
    title('Indices of Matching Endmembers')
    colorbar

    Read hyperspectral data into the workspace.

    hcube = hypercube('jasperRidge2_R198.hdr');

    Find the first 10 endmembers of the hyperspectral data.

    numEndmembers = 10;
    endmembers = nfindr(hcube,numEndmembers);

    Consider the first endmember as the reference spectrum and the rest of the endmembers as the test spectrum.

    refSpectrum = endmembers(:,1);
    testSpectra = endmembers(:,2:end);

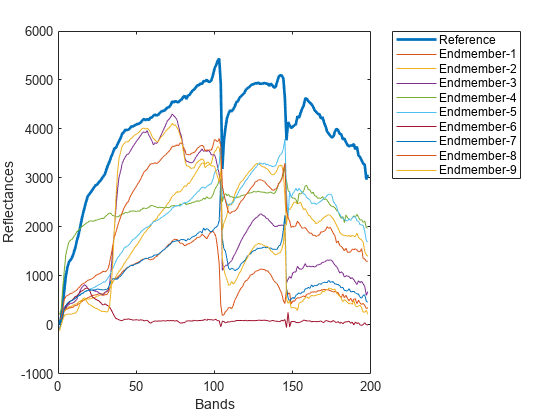
    Plot the reference spectrum and other endmember spectra.

    figure
    plot(refSpectrum,'LineWidth',2);
    hold on
    plot(testSpectra);
    hold off
    label = cell(1,numEndmembers-1);
    label{1} = 'Reference';
    for itr = 1:numEndmembers-1
        label{itr+1} = ['Endmember-' num2str(itr)];
    end
    xlabel('Bands')
    ylabel('Reflectances')
    legend(label,'Location','Bestoutside');

    Compute the SID-SAM score between the reference and test spectra.

    score = zeros(1,numEndmembers-1);
    for itr = 1:numEndmembers-1
        testSpectrum = testSpectra(:,itr);
        score(itr) = sidsam(testSpectrum,refSpectrum);
    end

    Find the test spectrum that exhibit maximum similarity (minimum distance) to the reference spectrum. Then find the test spectrum that exhibit minimum similarity (maximum distance) to the reference spectrum.

    [minval,minidx] = min(score);
    maxMatch = testSpectra(:,minidx);
    [maxval,maxidx] = max(score);
    minMatch = testSpectra(:,maxidx);

    Plot the reference spectrum, the maximum similarity, and the minimum similarity test spectra. The test spectrum with the minimum score value indicates highest similarity to the reference endmember. On the other hand, the test spectrum with the maximum score value has the highest spectral variability and characterises the spectral behaviour of two different materials.

    figure
    plot(refSpectrum,'LineWidth',2)
    hold on
    plot(maxMatch,'k')
    plot(minMatch,'r')
    xlabel('Band Number')
    ylabel('Data Values')
    legend('Reference spectrum','Maximum match test spectrum','Minimum match test spectrum',...
           'Location','Southoutside')
    title('Similarity Between Spectra')
    text(20,1000,['Max score: ' num2str(maxval)],'Color','r')
    text(145,1800,['Min score: ' num2str(minval)],'Color','k')

    Input Arguments

    collapse all

    Input hyperspectral data, specified as a hypercube object or a 3-D numeric array containing the data cube. If the input is a hypercube object, the data is read from the DataCube property of the object.

    Test spectrum, specified as a C-element vector. The test spectrum is the spectral signature of an unknown region or material.

    Data Types: single | double | int8 | int16 | int32 | int64 | uint8 | uint16 | uint32 | uint64

    Reference spectrum, specified as a C-element vector. The reference spectrum is the spectral signature of a known region or material. The function matches the test spectrum against these values.

    Data Types: single | double | int8 | int16 | int32 | int64 | uint8 | uint16 | uint32 | uint64

    Output Arguments

    collapse all

    SID-SAM score, returned as a scalar or matrix. The output is a

    • scalar — If you specify the testSpectrum input argument. The function matches the test spectral signature against the reference spectral signature and returns a scalar value. Both the test and the reference spectra must be vectors of same length.

    • matrix — If you specify the inputData input argument. The function matches the spectral signature of each pixel in the data cube against the reference spectral signature and returns a matrix. If the data cube is of size M-by-N-by-C and the reference spectra is a vector of length C, the output matrix is of size M-by-N.

    A smaller SID-SAM score indicates a strong match between the test signature and the reference signature.

    Data Types: single | double

    Algorithms

    collapse all

    Spectral Angle Mapper (SAM)

    The sidsam function computes the SAM score α using this formula.

    α=cos1(i=1Ctirii=1Cti2i=1Cri2).

    where, r and t are the reference and test spectra, respectively. ri and ti are the ith elements of the vectors r and t, respectively. C is the length of vectors r and t.

    Spectral Information Divergence (SID)

    The sidsam function normalizes the reference spectra refSpectra, and test spectra testSpectra, and computes the SID value using this formula.

    SID=i=1Cpilog(piqi)+i=1Cqilog(qipi).

    q and p are the vectors of normalized reference and test spectra, respectively. qi and pi are the ith elements of the vectors q and p, respectively. C is the length of vectors q and p.

    SID-SAM

    The sidsam function computes the SID-SAM value using this formula.

    SIDSAM=SID×tan(α)

    SID is the SID value, and α is the SAM score.

    References

    [1] Chang, Chein-I. “New Hyperspectral Discrimination Measure for Spectral Characterization.” Optical Engineering 43, no. 8 (August 1, 2004): 1777. https://doi.org/10.1117/1.1766301.

    Version History

    Introduced in R2020b