roifill
(Not recommended) Fill in specified region of interest (ROI) polygon in grayscale image
roifill is not recommended. Use regionfill instead. If you want to define the polygon interactively with
regionfill, then use regionfill either
with roipoly or with drawpolygon followed by createMask.
Syntax
Description
Use the roifill function to fill in a specified region of
interest (ROI) polygon in a grayscale image. roifill smoothly
interpolates inward from the pixel values on the boundary of the polygon by solving
Laplace's equation. The boundary pixels are not modified. roifill
can be used, for example, to erase objects in an image.
J = roifillroifill fills the selected polygon and returns the
filled image, J.
For more information about using the polygon selection tool to define and fill ROIs, see Interactive Behavior.
roifill(___) without an output argument
displays the filled image in a new figure window.
Examples
Read and display a grayscale image.
I = imread('eight.tif');
imshow(I)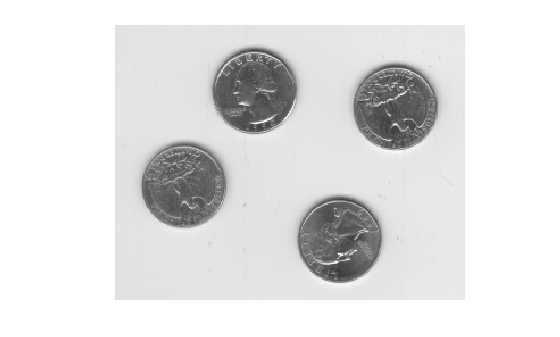
Specify the x- and y-coordinates of a polygon that completely surrounds one of the coins in the image.
x = [222 272 300 270 221 194];
y = [21 21 75 121 121 75];
Fill the polygon by using the regionfill function.
J = regionfill(I,x,y);
Display the filled image.
imshow(J)
title('Filled Image with One Fewer Coin')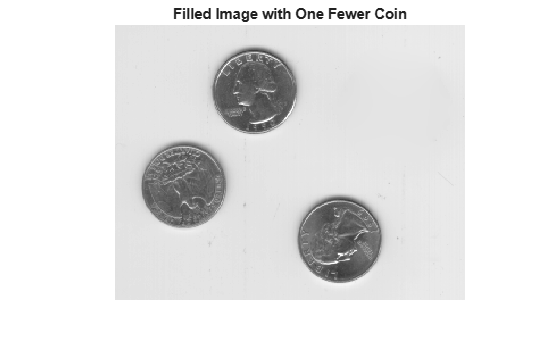
Input Arguments
Output Arguments
More About
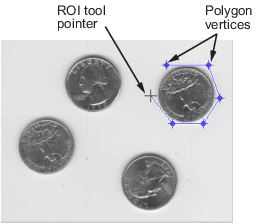
When you call roifill with an interactive
syntax, a polygon selection tool opens that enables you to select and adjust polygon
vertices interactively using the mouse.
When the polygon tool is active, the pointer changes to cross hairs
![]() when you move the pointer over the image in the
figure. Using the mouse, specify the region by selecting vertices of the polygon.
You can move or resize the polygon using the mouse. When you are finished
positioning and sizing the polygon, fill the polygon by double-clicking, or by
right-clicking inside the region and selecting Fill Area
from the context menu.
when you move the pointer over the image in the
figure. Using the mouse, specify the region by selecting vertices of the polygon.
You can move or resize the polygon using the mouse. When you are finished
positioning and sizing the polygon, fill the polygon by double-clicking, or by
right-clicking inside the region and selecting Fill Area
from the context menu.
The figure illustrates a polygon defined by multiple vertices.
| Interactive Behavior | Description |
|---|---|
| Closing the polygon (completing the ROI) | Use any of the following mechanisms:
|
| Deleting the polygon | Press Backspace, Escape or Delete, or right-click inside the region and select Cancel from the context menu. Note: If you delete the ROI, the function returns empty values. |
| Moving the polygon | Move the pointer inside the region. The pointer changes to a
fleur |
| Changing the color of the polygon | Move the pointer inside the region. Right-click and select Set color from the context menu. |
| Adding a new vertex | Move the pointer over an edge of the polygon and press the
A key. The shape of the pointer changes
|
| Moving a vertex (reshaping the ROI) | Move the pointer over a vertex. The pointer changes to a circle
|
| Deleting a vertex | Move the pointer over a vertex. The pointer changes to a circle
|
| Retrieving the coordinates of the vertices | Move the pointer inside the region. Right-click and select Copy position from the context menu to copy the current position to the Clipboard. Position is an n-by-2 array containing the x- and y-coordinates of each vertex, where n is the number of vertices you selected. |
Version History
Introduced before R2006a
See Also
drawpolygon | Polygon | roifilt2 | roipoly | regionfill | inpaintCoherent