Main Content

measureTexture

Measure sharpness of texture using Dead Leaves test chart

Since R2024b

Description

[sfr,psd,psdRef] = measureTexture(im,roiTexture,roiUniform) calculates the spatial frequency response (SFR) of a Dead Leaves, Spilled Coins, or similar test chart image, im. For these types of test charts, the SFR is a metric for the sharpness of texture. The function also measures the power spectral density (PSD) of the test chart and a simulated reference image, and returns the measurements in psd and psdRef, respectively.

The function simulates a reference image based on regions of interest (ROIs) for texture regions and uniform regions, specified as roiTexture and roiUniform, respectively [1].

example

[sfr,psd,psdRef] = measureTexture(im,roiTexture,roiUniform,imRef,roiTextureRef,roiUniformRef) calculates the SFR using a real reference image, imRef. The function calculates the PSDs using additional information about ROIs of texture regions and uniform regions within the reference image, specified as roiTextureRef and roiUniformRef, respectively.

Examples

collapse all

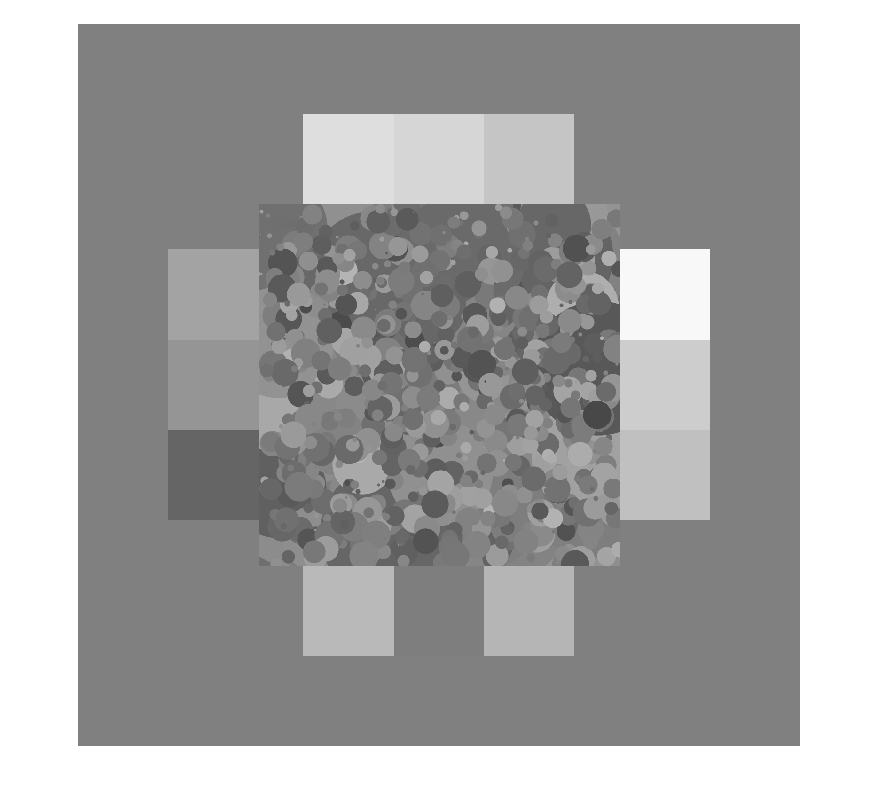
Read and display a grayscale test chart image.

im = imread("paintGrayscale.png");
imshow(im)

Figure contains an axes object. The hidden axes object contains an object of type image.

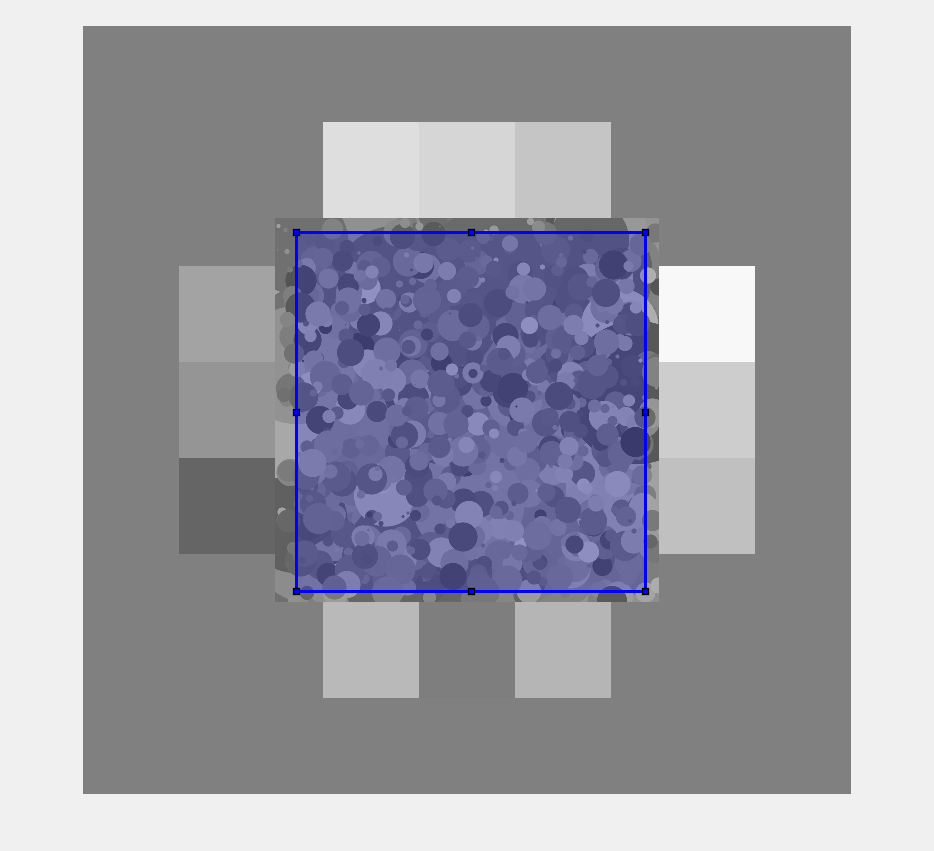
Select an ROI of the texture region.

roi = drawrectangle(Color="blue");

Figure contains an axes object. The hidden axes object contains 2 objects of type image, images.roi.rectangle.

textureROI = roi.Position;

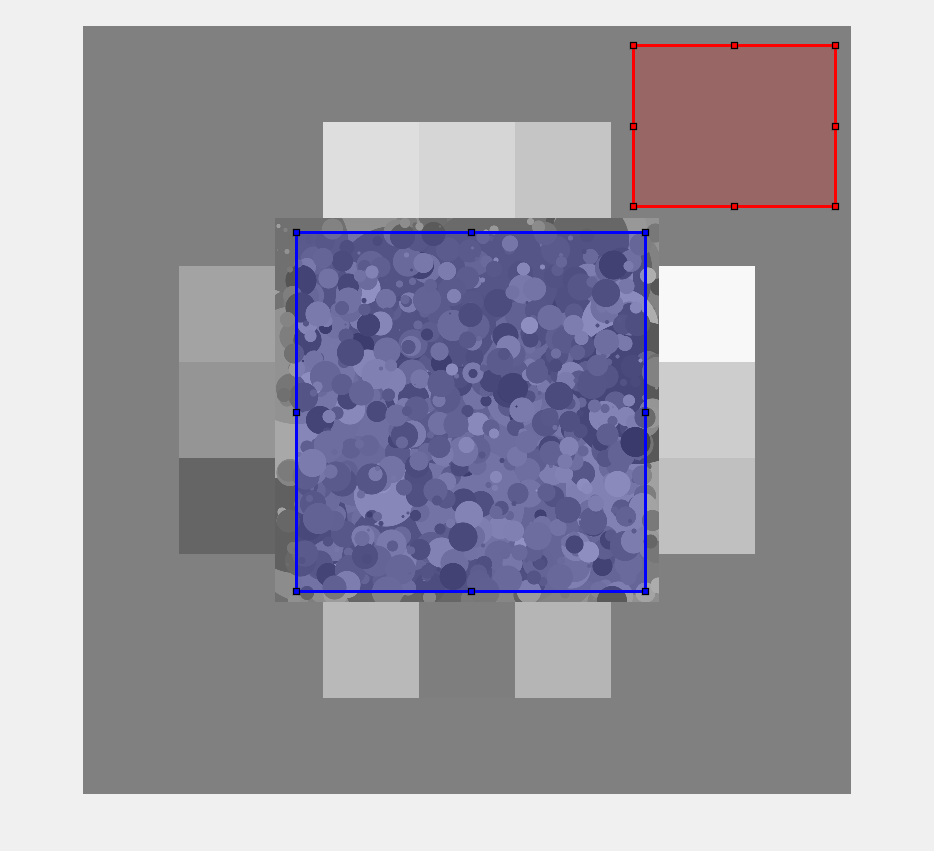
Select an ROI consisting of uniform background.

roi = drawrectangle(Color="red");

Figure contains an axes object. The hidden axes object contains 3 objects of type image, images.roi.rectangle.

uniformROI = roi.Position;

Measure the sharpness of the texture.

sfr = measureTexture(im,textureROI,uniformROI);

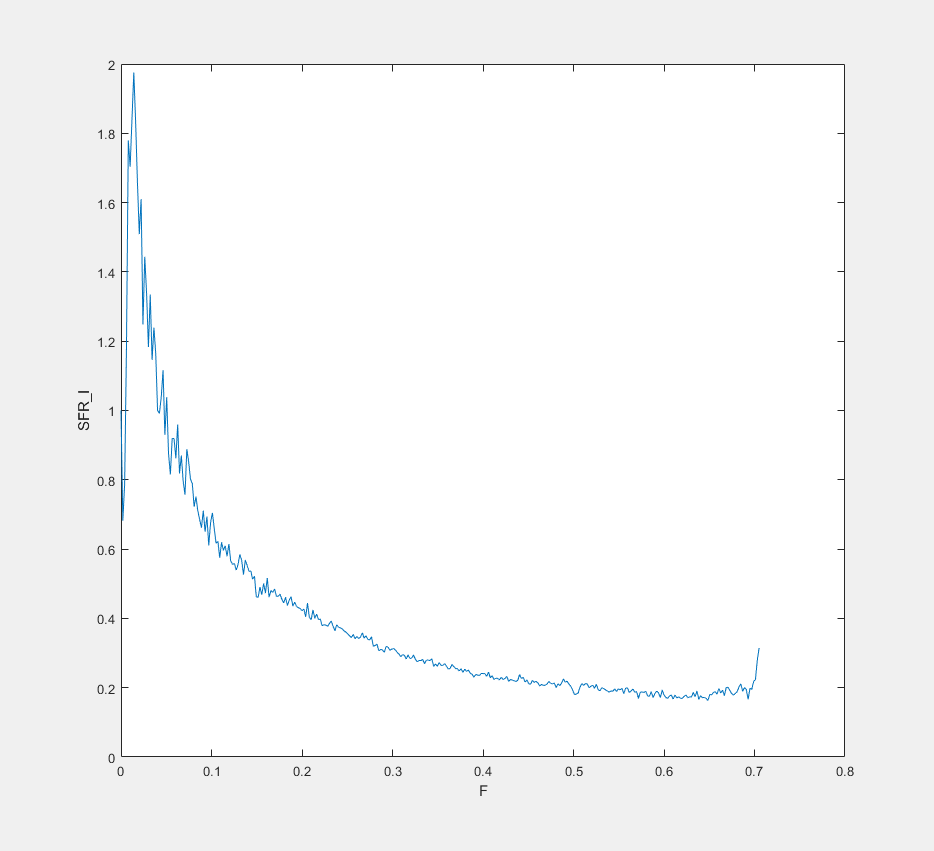
Plot the SFR values as a function of frequency.

plot(sfr,"F","SFR_I")

Figure contains an axes object. The axes object with xlabel F, ylabel SFR_I contains an object of type line.

Input Arguments

collapse all

Test chart image, specified as an RGB image or a grayscale image.

Position of a texture ROI in the test image, specified as a 1-by-4 numeric vector. The vector has the form [X Y Width Height], where X and Y are the coordinates of the top-left corner of the ROI. Width and Height are the width and height of the ROI, in pixels.

Position of a uniform ROI in the test image, specified as a 1-by-4 numeric vector. The vector has the form [X Y Width Height], where X and Y are the coordinates of the top-left corner of the ROI. Width and Height are the width and height of the ROI, in pixels.

Reference chart image, specified as an RGB image or a grayscale image.

Position of a texture ROI in the reference image, specified as a 1-by-4 numeric vector. The vector has the form [X Y Width Height], where X and Y are the coordinates of the top-left corner of the ROI. Width and Height are the width and height of the ROI, in pixels.

Position of a uniform ROI in the reference image, specified as a 1-by-4 numeric vector. The vector has the form [X Y Width Height], where X and Y are the coordinates of the top-left corner of the ROI. Width and Height are the width and height of the ROI, in pixels.

Output Arguments

collapse all

Spatial frequency response of the texture ROI in the test image, returned as a table. The table has f rows, where f is the number of frequency samples.

For color test chart images, the table has five columns.

VariableDescription
FFrequency at which the SFR is sampled, returned as a numeric scalar.
SFR_R

SFR measurement at frequency F of the red channel of the test image, returned as a numeric scalar.

SFR_G

SFR measurement at frequency F of the green channel of the test image, returned as a numeric scalar.

SFR_B

SFR measurement at frequency F of the blue channel of the test image, returned as a numeric scalar.

SFR_Y

SFR measurement at frequency F of the luminance of the test image, returned as a numeric scalar. Luminance (Y) is a linear combination of the red (R), green (G), and blue (B) channels according to:

Y = 0.213R + 0.715G + 0.072B

For grayscale test chart images, the table has two columns.

VariableDescription
FFrequency at which the SFR is sampled, returned as a numeric scalar.
SFR_I

SFR measurement at frequency F of the intensity of the test image, returned as a numeric scalar.

PSD of the test image, returned as a table. The table has f rows, where f is the number of frequency samples.

For color test chart images, the table has five columns.

VariableDescription
FFrequency at which the SFR is sampled, returned as a numeric scalar.
PSD_R

PSD measurement at frequency F of the red channel of the test image, returned as a numeric scalar.

PSD_G

PSD measurement at frequency F of the green channel of the test image, returned as a numeric scalar.

PSD_B

PSD measurement at frequency F of the blue channel of the test image, returned as a numeric scalar.

PSD_Y

PSD measurement at frequency F of the luminance of the test image, returned as a numeric scalar. Luminance (Y) is a linear combination of the red (R), green (G), and blue (B) channels according to:

Y = 0.213R + 0.715G + 0.072B

For grayscale test chart images, the table has two columns.

VariableDescription
FFrequency at which the SFR is sampled, returned as a numeric scalar.
PSD_I

PSD measurement at frequency F of the intensity of the test image, returned as a numeric scalar.

PSD of the reference image, returned as a table. The table has f rows, where f is the number of frequency samples.

For color test chart images, the table has five columns.

VariableDescription
FFrequency at which the SFR is sampled, returned as a numeric scalar.
PSD_R

PSD measurement at frequency F of the red channel of the reference image, returned as a numeric scalar.

PSD_G

PSD measurement at frequency F of the green channel of the reference image, returned as a numeric scalar.

PSD_B

PSD measurement at frequency F of the blue channel of the reference image, returned as a numeric scalar.

PSD_Y

PSD measurement at frequency F of the luminance of the reference image, returned as a numeric scalar. Luminance (Y) is a linear combination of the red (R), green (G), and blue (B) channels according to:

Y = 0.213R + 0.715G + 0.072B

For grayscale test chart images, the table has two columns.

VariableDescription
FFrequency at which the SFR is sampled, returned as a numeric scalar.
PSD_I

PSD measurement at frequency F of the intensity of the reference image, returned as a numeric scalar.

References

[1] McElvain, Jon, Scott P. Campbell, Jonathan Miller, and Elaine W. Jin. “Texture-Based Measurement of Spatial Frequency Response Using the Dead Leaves Target: Extensions, and Application to Real Camera Systems.” In Digital Photography VI, 7537:115–25. SPIE, 2010. https://doi.org/10.1117/12.838698.

Version History

Introduced in R2024b