imhistmatch
Adjust histogram of 2-D image to match histogram of reference image
Syntax
Description
J = imhistmatch(I,ref)I such that the histogram approximately matches the
histogram of the reference image ref.
If both
Iandrefare RGB images, thenimhistmatchmatches each color channel ofIindependently to the corresponding color channel ofref.If
Iis an RGB image andrefis a grayscale image, thenimhistmatchmatches each channel ofIagainst the single histogram derived fromref.If
Iis a grayscale image, thenrefmust also be a grayscale image.
Images I and ref need not be equal in size.
J = imhistmatch(I,ref,nbins)nbins equally spaced bins within the appropriate range
for the given image data type. The returned image J has no
more than nbins discrete levels.
If the data type of the image is either
singleordouble, then the histogram range is [0, 1].If the data type of the image is
uint8, then the histogram range is [0, 255].If the data type of the image is
uint16, then the histogram range is [0, 65535].If the data type of the image is
int16, then the histogram range is [-32768, 32767].
Examples
These aerial images, taken at different times, represent overlapping views of the same terrain in Concord, Massachusetts. This example demonstrates that input images A and Ref can be of different sizes and image types.
Load an RGB image and a reference grayscale image.
A = imread("westconcordaerial.png");
Ref = imread("westconcordorthophoto.png");
Get the size of A.
size(A)
ans = 1×3

   394   369     3
Get the size of Ref.
size(Ref)
ans = 1×2

   366   364
Note that image A and Ref are different in size and type. Image A is a truecolor RGB image, while image Ref is a grayscale image. Both images are of data type uint8.
Generate the histogram matched output image. The example matches each channel of A against the single histogram of Ref. Output image B takes on the characteristics of image A - it is an RGB image whose size and data type is the same as image A. The number of distinct levels present in each RGB channel of image B is the same as the number of bins in the histogram built from grayscale image Ref. In this example, the histogram of Ref and B have the default number of bins, 64.
B = imhistmatch(A,Ref);
Display the RGB image A, the reference image Ref, and the histogram matched RGB image B. The images are resized before display.
imshow(A)
title("RGB Image with Color Cast")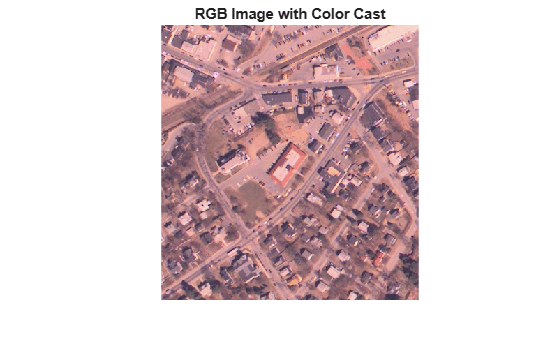
imshow(Ref)
title("Reference Grayscale Image")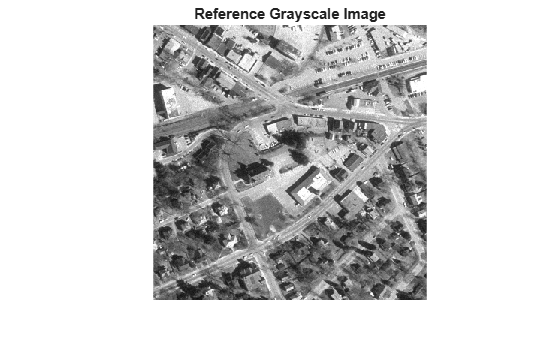
imshow(B)
title("Histogram Matched RGB Image")
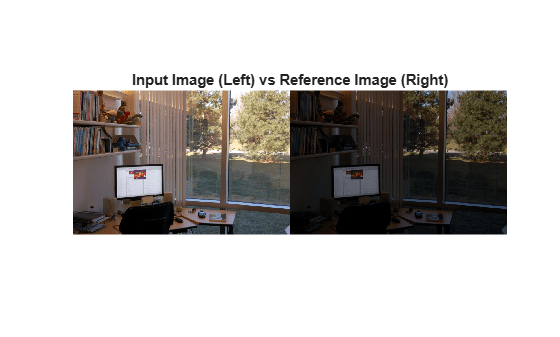
Read a color image and a reference image. To demonstrate the polynomial method, assign the reference image to be the darker of the two images.
I = imread('office_4.jpg');
ref = imread('office_2.jpg');
montage({I,ref})
title('Input Image (Left) vs Reference Image (Right)');
Use the polynomial method to adjust the intensity of image I so that it matches the histogram of reference image ref. For comparison, also adjust the intensity of image I using the uniform method.
J = imhistmatch(I,ref,'method','polynomial');
K = imhistmatch(I,ref,'method','uniform');
montage({J,K})
title('Histogram-Matched Image Using Polynomial Method (Left) vs Uniform Method (Right)');
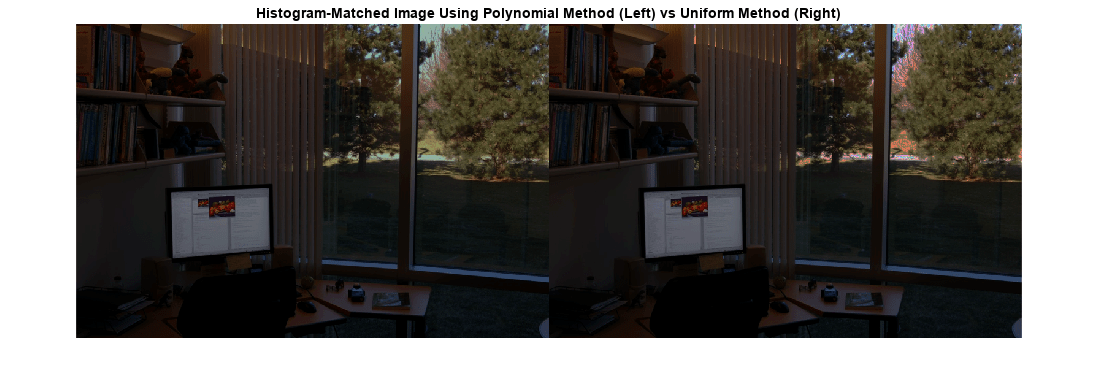
The histogram-matched image using the uniform method introduces false colors in the sky and road. The histogram-matched image using the polynomial method does not exhibit this artifact.
This example shows how you can vary the number of bins in the target histogram to improve histogram equalization.
Load two images of data type uint8 into the workspace. The images were taken with a digital camera and represent two different exposures of the same scene. A is an underexposed image and appears dark. ref is a reference image with good exposure and brightness.
A = imread('office_2.jpg');
ref = imread('office_4.jpg');
Display the images in a montage.
montage({A,ref})
title('Dark Image (Left) and Reference Image (Right)')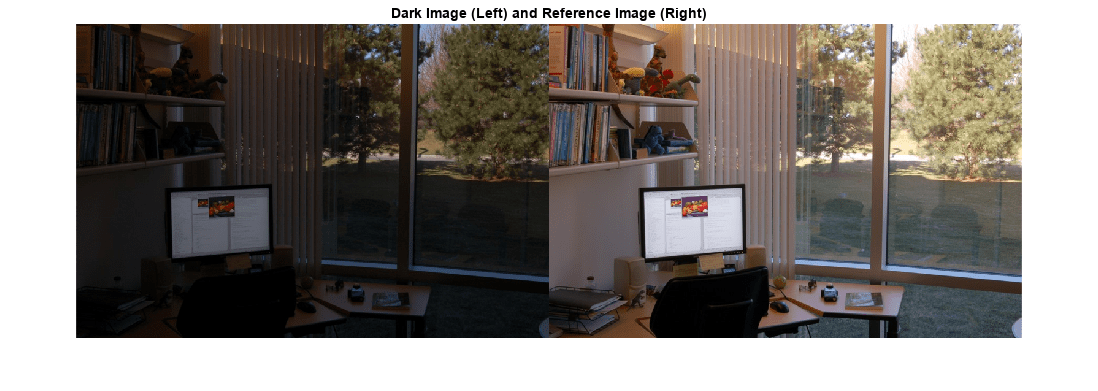
Display the histogram of each color channel using 256 bins. You can use the helper function, displayHistogramChannels, that is included with the example.
displayHistogramChannels(A,ref)
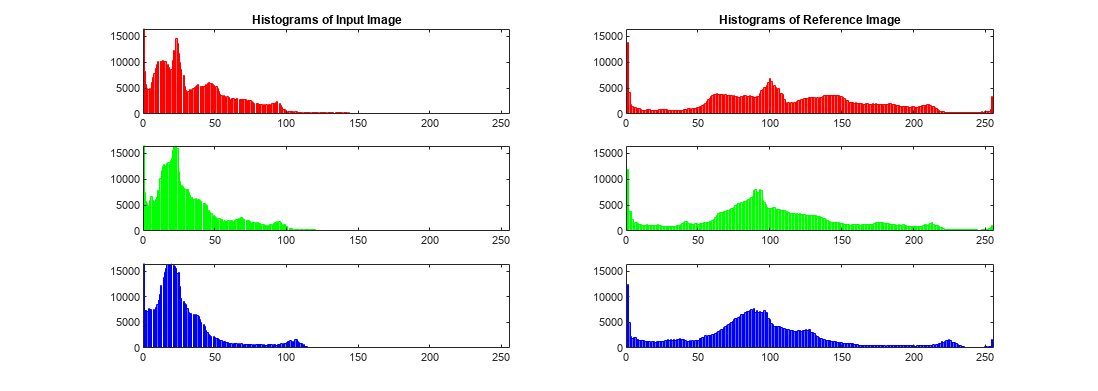
Image A, being the darker image, has most of its pixels in the lower bins. The reference image, ref, fully populates all 256 bins values in all three RGB channels.
Count the number of unique 8-bit level values for each color channel of the dark and reference image. You can use the helper function, countUniqueValues, that is included with the example.
numVals = countUniqueValues(A,ref);
table(numVals(:,1),numVals(:,2),numVals(:,3), ...
  'VariableNames',["Red" "Green" "Blue"], ...
  'RowNames',["A" "ref"])
ans=2×3 table
           Red    Green    Blue
           ___    _____    ____

    A      205     193     224
    ref    256     256     256
Equalize the histogram of the dark image using three different values of nbins: 64, 128 and 256. 64 is the default number of bins and 256 is the maximum number of bins for uint8 pixel data.
[B64,hgram64]   = imhistmatch(A,ref,64);
[B128,hgram128] = imhistmatch(A,ref,128);
[B256,hgram256] = imhistmatch(A,ref,256);

figure
montage({B64,B128,B256},'Size',[1 3])
title('Output Image B64  |  Output Image B128  |  Output Image B256')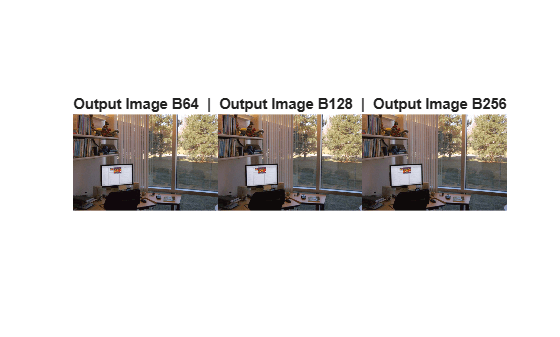
Display the histogram of each color channel using 256 bins. You can use the helper function, displayThreeHistogramChannels, that is included with the example.
displayThreeHistogramChannels(B64,B128,B256)
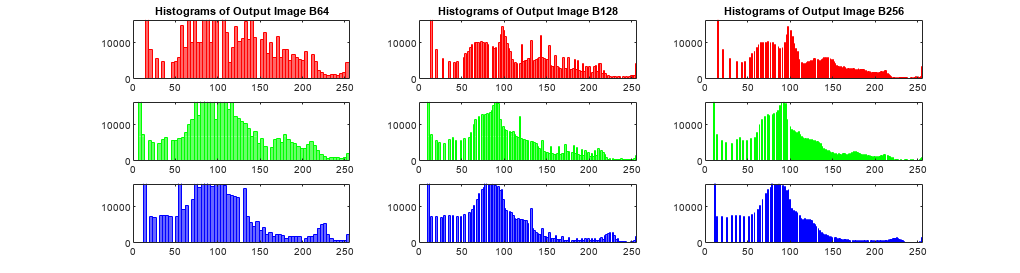
Count the number of unique 8-bit level values for each color channel of the three histogram equalized images. As nbins increases, the number of levels in each RGB channel of output image B also increases.
numVals = countUniqueValues(B64,B128,B256);
table(numVals(:,1),numVals(:,2),numVals(:,3), ...
  'VariableNames',["Red" "Green" "Blue"], ...
  'RowNames',["B64" "B128" "B256"])
ans=3×3 table
            Red    Green    Blue
            ___    _____    ____

    B64      57      60      58
    B128    101     104     104
    B256    134     135     136
This example shows how to perform histogram matching with different numbers of bins.
Load a 16-bit DICOM image of a knee imaged via MRI.
K = dicomread('knee1.dcm');   % read in original 16-bit image
LevelsK = unique(K(:));       % determine number of unique code values
disp(['image K: ',num2str(length(LevelsK)),' distinct levels']);
image K: 448 distinct levels
disp(['max level = ' num2str( max(LevelsK) )]);max level = 473
disp(['min level = ' num2str( min(LevelsK) )]);min level = 0
All 448 discrete values are at low code values, which causes the image to look dark. To rectify this, scale the image data to span the entire 16-bit range of [0, 65535].
Kdouble = double(K);                  % cast uint16 to double
kmult = 65535/(max(max(Kdouble(:)))); % full range multiplier
Ref = uint16(kmult*Kdouble);   % full range 16-bit reference image
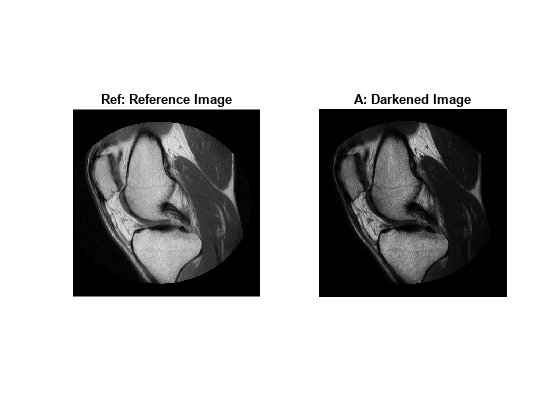
Darken the reference image Ref to create an image A that can be used in the histogram matching operation.
%Build concave bow-shaped curve for darkening |Ref|.
ramp = [0:65535]/65535;
ppconcave = spline([0 .1 .50  .72 .87 1],[0 .025 .25 .5 .75 1]);
Ybuf = ppval( ppconcave, ramp);
Lut16bit = uint16( round( 65535*Ybuf ) );
% Pass image |Ref| through a lookup table (LUT) to darken the image.
A = intlut(Ref,Lut16bit);
View the reference image Ref and the darkened image A. Note that they have the same number of discrete code values, but differ in overall brightness.
subplot(1,2,1)
imshow(Ref)
title('Ref: Reference Image')
subplot(1,2,2)
imshow(A)
title('A: Darkened Image');
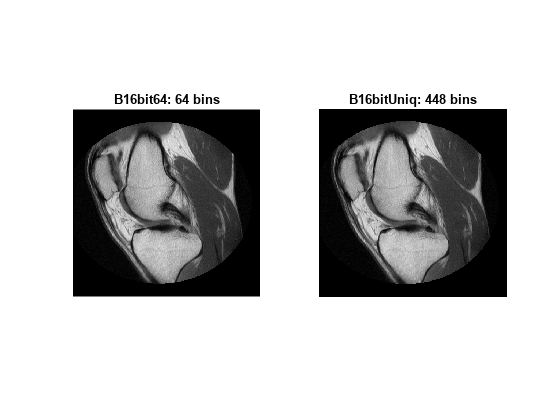
Generate histogram-matched output images using histograms with different number of bins. First use the default number of bins, 64. Then use the number of values present in image A, 448 bins.
B16bit64 = imhistmatch(A(:,:,1),Ref(:,:,1));  % default: 64 bins

N = length(LevelsK);     % number of unique 16-bit code values in image A.
B16bitUniq = imhistmatch(A(:,:,1),Ref(:,:,1),N);
View the results of the two histogram matching operations.
figure
subplot(1,2,1)
imshow(B16bit64)
title('B16bit64: 64 bins')
subplot(1,2,2)
imshow(Ref)
title(['B16bitUniq: ',num2str(N),' bins'])
Input Arguments
Output Arguments
Algorithms
The objective of imhistmatch is to transform image I
such that the histogram of image J matches the histogram derived
from image ref. It consists of nbins equally
spaced bins which span the full range of the image data type. A consequence of matching
histograms in this way is that nbins also represents the upper
limit of the number of discrete data levels present in image
J.
An important behavioral aspect of this algorithm to note is that as nbins
increases in value, the degree of rapid fluctuations between adjacent populated peaks in
the histogram of image J tends to increase. This can be seen in the
following histogram plots taken from the 16–bit grayscale MRI example.
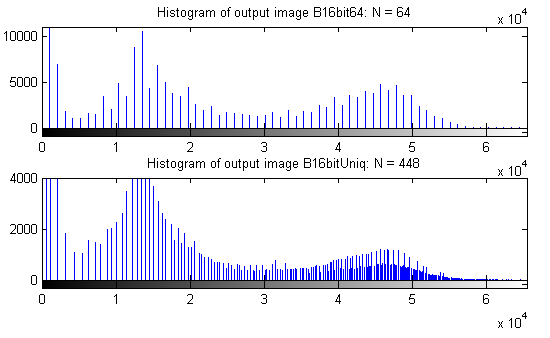
An optimal value for nbins represents a
trade-off between more output levels (larger values of nbins)
while minimizing peak fluctuations in the histogram (smaller values
of nbins).
Version History
Introduced in R2012b