colorize
Estimate color image of spectral image
Syntax
Description
coloredImage = colorize(spcube)spcube is a hypercube object and an RGB image when
spcube is a multicube object.
coloredImage = colorize(spcube,band)band.
[
returns the indices of the bands used in the color image when coloredImage,indices] = colorize(___)spcube is
a hypercube object.
___ = colorize(___,
specifies options using one or more name-value arguments in addition to any combination of
arguments from previous syntaxes. Use this syntax to specify the options to estimate
false-colored and color-infrared (CIR) images of the input data.Name=Value)
Note
This function requires the Hyperspectral Imaging Library for Image Processing Toolbox™. You can install the Hyperspectral Imaging Library for Image Processing Toolbox from Add-On Explorer. For more information about installing add-ons, see Get and Manage Add-Ons.
The Hyperspectral Imaging Library for Image Processing Toolbox requires desktop MATLAB®, as MATLAB Online™ and MATLAB Mobile™ do not support the library.
Examples
Read a hyperspectral data into the workspace.
hcube = imhypercube("paviaU.dat");Estimate a false-color image of the hyperspectral data.
coloredImg = colorize(hcube);
Display the false-color image.
imshow(coloredImg)

Download Landsat 8 multispectral data.
zipfile = "LC08_L1TP_113082_20211206_20211215_02_T1.zip";
landsat8Data_url = "https://ssd.mathworks.com/supportfiles/image/data/" + zipfile;
hyper.internal.downloadLandsatDataset(landsat8Data_url,zipfile)
filepath = fullfile("LC08_L1TP_113082_20211206_20211215_02_T1","LC08_L1TP_113082_20211206_20211215_02_T1_MTL.txt");
Read a multispectral image into the workspace.
mcube = immulticube(filepath);
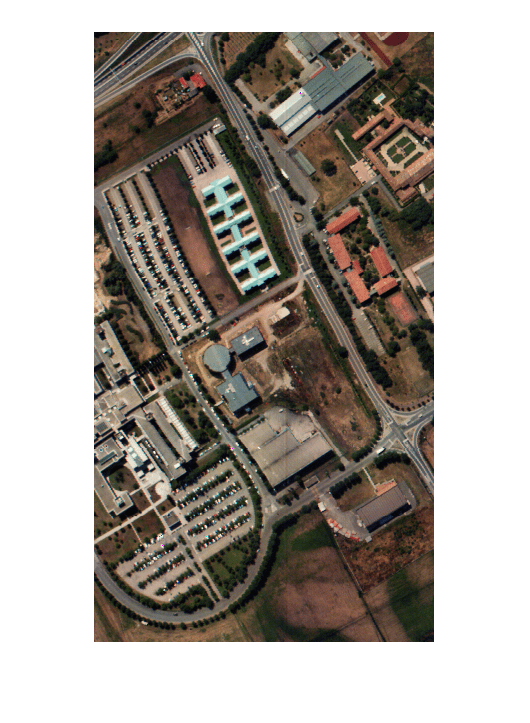
Estimate an RGB image of the multispectral data. Increase the image contrast by applying contrast stretching.
coloredImg = colorize(mcube,ContrastStretching=true);
Display the contrast-stretched RGB image.
imshow(coloredImg)
Input Arguments
Name-Value Arguments
Output Arguments
Version History
Introduced in R2020a