dataPlotOptions
Option set for idplot when plotting input/output estimation data
contained in a timetable, numeric matrices, or an iddata
object
Since R2023a
Syntax
Description
opt = dataPlotOptions('time')
opt = dataPlotOptions(___,'identpref')
Examples
Create an options set with default options for time-domain data.
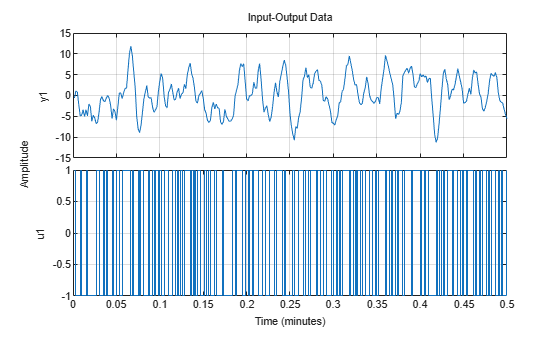
opt = dataPlotOptions('time');Specify plot properties, such as time units and grid. View the plot in minutes
 opt.TimeUnits = 'minutes';
 % Turn grid on
 opt.Grid = 'on';
Create a plot using the specified options.
load iddata1 z1
h = idplot(z1, opt);
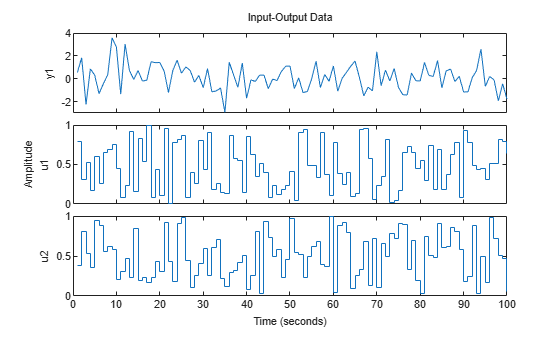
Generate data with two inputs and one output.
z = iddata(randn(100,1),rand(100,2));
Configure a time plot.
opt = iddataPlotOptions('time');Plot the data.
h = idplot(z,opt);

Change the orientation of the plots such that all inputs are plotted in one column, and all outputs are in a second column.
opt.Orientation = 'two-column';
h = idplot(z,opt);
Alternatively, use setoptions.
setoptions(h,'Orientation','two-column')
You can also change the orientation by right-clicking the plot and choosing Orientation in the context menu.
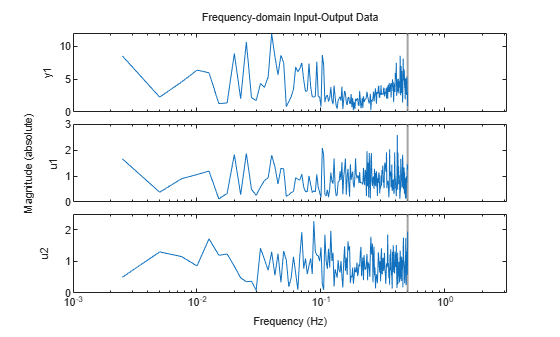
Create an option set with default options for frequency-domain data.
opt = dataPlotOptions('frequency');Specify plot properties, such as phase visibility and frequency units.
opt.PhaseVisible = 'off';
opt.FreqUnits = 'Hz';
Create a plot with the specified options.
load iddata7 z7
zf = fft(z7);
h = idplot(zf,opt);
opt = dataPlotOptions('time','identpref');
Output Arguments
Option set containing the specified options for idplot. The structure has
the following fields:
| Field | Description | ||||||||||||||||||||||||||||||
|---|---|---|---|---|---|---|---|---|---|---|---|---|---|---|---|---|---|---|---|---|---|---|---|---|---|---|---|---|---|---|---|
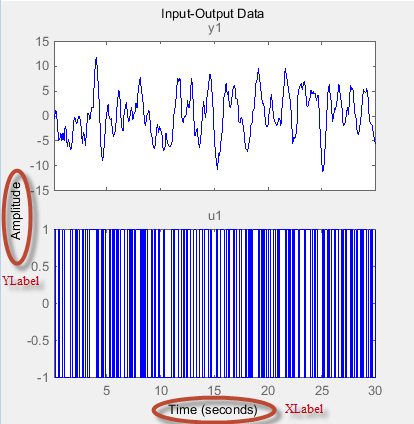
Title, XLabel,
YLabel
| Text and style for axes labels and plot title, specified as a structure array with the following fields:
| ||||||||||||||||||||||||||||||
TickLabel | Tick label style, specified as a structure array with the following fields:
| ||||||||||||||||||||||||||||||
Grid | Show or hide the grid, specified as one of the
following values: Default:
| ||||||||||||||||||||||||||||||
GridColor | Color of the grid lines, specified as one of the
following values: vector of RGB values in the range
Default:
| ||||||||||||||||||||||||||||||
XlimMode,
YlimMode | Axes limit modes, specified as one of the following values:
Default:
| ||||||||||||||||||||||||||||||
Xlim, Ylim
| Axes limits, specified as maximum and minimum values. Default: | ||||||||||||||||||||||||||||||
IOGrouping
| Grouping of input-output pairs, specified as one of
the following values: Default:
| ||||||||||||||||||||||||||||||
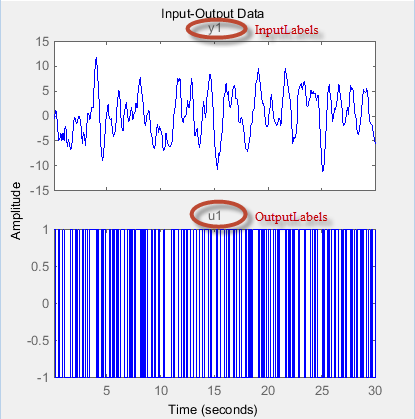
InputLabels,
OutputLabels
| Input and output label styles on individual plot axes, specified as a structure array with the following fields:
| ||||||||||||||||||||||||||||||
InputVisible,
OutputVisible | Visibility of input and output channels, specified
as one of the following values: Default:
| ||||||||||||||||||||||||||||||
Orientation | Orientation of the input and output data plots, specified as one of the following values:
Default:
| ||||||||||||||||||||||||||||||
For time-domain data plots only:
| |||||||||||||||||||||||||||||||
For frequency-domain data plots only:
| |||||||||||||||||||||||||||||||