categoryReturnsChart
Description
categoryReturnsChart( creates a
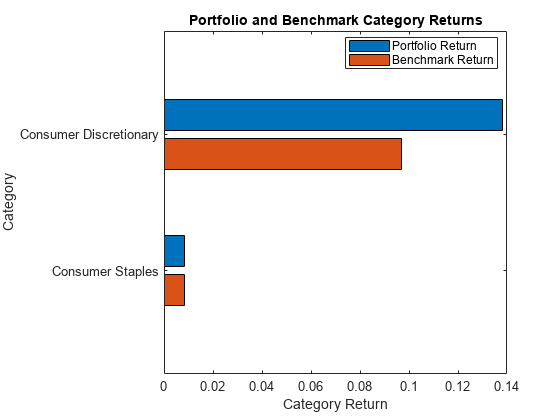
horizontal bar chart of portfolio and benchmark category returns, aggregated over all time
periods using a BrinsonPAObj)brinsonAttribution
object.
h = categoryReturnsChart(ax,BrinsonPAObj)h.
Examples
This example shows how to create a brinsonAttribution object that you can then use with the categoryReturnsChart function to generate a bar chart of category returns.
Prepare Data
Create a table for the monthly prices for four assets.
 GM =[17.82;22.68;19.37;20.28];
 HD = [39.79;39.12;40.67;40.96];
 KO = [38.98;39.44;40.00;40.20];
 PG = [56.38;57.08;57.76;55.54];
 MonthlyPrices  = table(GM,HD,KO,PG);
Use tick2ret to define the monthly returns.
MonthlyReturns = tick2ret(MonthlyPrices.Variables)';
  [NumAssets,NumPeriods] = size(MonthlyReturns);
Define the periods.
Period = ones(NumAssets*NumPeriods,1);
  for k = 1:NumPeriods
      Period(k*NumAssets+1:end,1) = Period(k*NumAssets,1) + 1;
  end
Define the categories (sectors) for the four assets.
Name = repmat(string(MonthlyPrices.Properties.VariableNames(:)),NumPeriods,1);
  Categories = repmat(categorical([ ...
      "Consumer Discretionary"; ...
      "Consumer Discretionary"; ...
      "Consumer Staples"; ...
      "Consumer Staples"]),NumPeriods,1);
Define benchmark and portfolio weights.
BenchmarkWeight = repmat(1./NumAssets.*ones(NumAssets, 1),NumPeriods,1);
  PortfolioWeight = repmat([1;0;1;1]./3,NumPeriods,1);
Create AssetTable Input
Create AssetTable as the input for the brinsonAttribution object.
  AssetTable = table(Period, Name, ...
      MonthlyReturns(:), Categories, PortfolioWeight, BenchmarkWeight, ...
      VariableNames=["Period","Name","Return","Category","PortfolioWeight","BenchmarkWeight"])
AssetTable=12×6 table
    Period    Name     Return             Category           PortfolioWeight    BenchmarkWeight
    ______    ____    _________    ______________________    _______________    _______________

      1       "GM"      0.27273    Consumer Discretionary        0.33333             0.25
      1       "HD"    -0.016838    Consumer Discretionary              0             0.25
      1       "KO"     0.011801    Consumer Staples              0.33333             0.25
      1       "PG"     0.012416    Consumer Staples              0.33333             0.25
      2       "GM"     -0.14594    Consumer Discretionary        0.33333             0.25
      2       "HD"     0.039622    Consumer Discretionary              0             0.25
      2       "KO"     0.014199    Consumer Staples              0.33333             0.25
      2       "PG"     0.011913    Consumer Staples              0.33333             0.25
      3       "GM"      0.04698    Consumer Discretionary        0.33333             0.25
      3       "HD"    0.0071306    Consumer Discretionary              0             0.25
      3       "KO"        0.005    Consumer Staples              0.33333             0.25
      3       "PG"    -0.038435    Consumer Staples              0.33333             0.25
Create brinsonAttribution Object
Use brinsonAttribution to create the brinsonAttribution object.
BrinsonPAobj = brinsonAttribution(AssetTable)
BrinsonPAobj =
  brinsonAttribution with properties:

                  NumAssets: 4
         NumPortfolioAssets: 3
         NumBenchmarkAssets: 4
                 NumPeriods: 3
              NumCategories: 2
                  AssetName: [4×1 string]
                AssetReturn: [4×3 double]
              AssetCategory: [4×3 categorical]
       PortfolioAssetWeight: [4×3 double]
       BenchmarkAssetWeight: [4×3 double]
    PortfolioCategoryReturn: [2×3 double]
    BenchmarkCategoryReturn: [2×3 double]
    PortfolioCategoryWeight: [2×3 double]
    BenchmarkCategoryWeight: [2×3 double]
            PortfolioReturn: 0.0598
            BenchmarkReturn: 0.0540
               ActiveReturn: 0.0059
Generate Horizontal Bar Chart for Category Returns
Use the brinsonAttribution object with categoryReturnsChart to generate a horizontal bar chart of portfolio and benchmark category returns, aggregated over all time periods.
categoryReturnsChart(BrinsonPAobj)

Input Arguments
brinsonAttribution object to analyze performance attribution. Use
brinsonAttribution to
create the brinsonAttribution object.
Data Types: object
(Optional) Valid axis object, specified as an ax object that you
create using axes.
categoryReturnsChart creates the plot on the axes specified by the
optional ax argument instead of on the current axes (gca). The
optional argument ax can precede any of the input argument
combinations. If you do not specify an axes object,
categoryReturnsChart plots into the current axes.
Data Types: object
Output Arguments
Figure handle for the category returns chart, returned as handle object. You can use the figure handle to access and change the properties of the chart.
Version History
Introduced in R2023a
MATLAB Command
You clicked a link that corresponds to this MATLAB command:
Run the command by entering it in the MATLAB Command Window. Web browsers do not support MATLAB commands.
Website auswählen
Wählen Sie eine Website aus, um übersetzte Inhalte (sofern verfügbar) sowie lokale Veranstaltungen und Angebote anzuzeigen. Auf der Grundlage Ihres Standorts empfehlen wir Ihnen die folgende Auswahl: .
Sie können auch eine Website aus der folgenden Liste auswählen:
So erhalten Sie die bestmögliche Leistung auf der Website
Wählen Sie für die bestmögliche Website-Leistung die Website für China (auf Chinesisch oder Englisch). Andere landesspezifische Websites von MathWorks sind für Besuche von Ihrem Standort aus nicht optimiert.
Amerika
- América Latina (Español)
- Canada (English)
- United States (English)
Europa
- Belgium (English)
- Denmark (English)
- Deutschland (Deutsch)
- España (Español)
- Finland (English)
- France (Français)
- Ireland (English)
- Italia (Italiano)
- Luxembourg (English)
- Netherlands (English)
- Norway (English)
- Österreich (Deutsch)
- Portugal (English)
- Sweden (English)
- Switzerland
- United Kingdom (English)