ttstates
Syntax
Description
Examples
Load the yearly Canadian inflation and interest rates data set. Extract the inflation rate based on consumer price index (INF_C) from the table.
load Data_Canada
INF_C = DataTable.INF_C;
Assume the following characteristics of the inflation rate series:
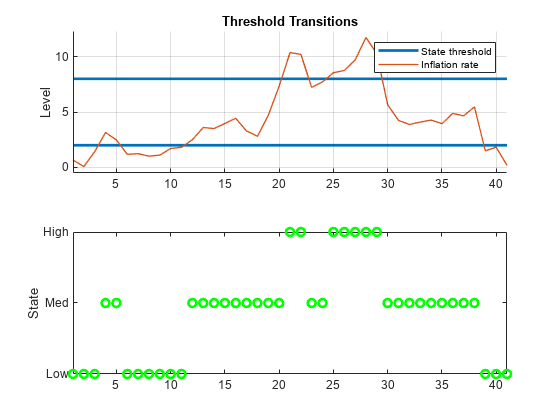
Rates below 2% are low.
Rates at least 2% and below 8% are medium.
Rates at least 8% are high.
States transition abruptly.
Create threshold transitions to describe the Canadian inflation rates.
statenames = ["Low" "Med" "High"];
tt = threshold([2 8],StateNames=statenames);
Infer the state path by passing the inflation rate series through the threshold transitions.
n = numel(INF_C);
states = ttstates(tt,INF_C);
snpath = tt.StateNames(states);
states is an n-by-1 vector of inferred state indices. snpath is the state path using state names instead of indices.
Separately plot the inflation rate series and inferred state path.
figure
tiledlayout(2,1)
nexttile
h = ttplot(tt,Data=INF_C);
legend(h([1 3]),["State threshold" "Inflation rate"])
nexttile
plot(states,'go',LineWidth=2)
ylabel('State')
yticks(1:3)
yticklabels(tt.StateNames)
axis tight
Input Arguments
Output Arguments
Algorithms
In threshold-switching dynamic regression models (tsVAR), state
transitions occur when a threshold variable crosses a transition mid-level. Discrete
transitions result in an abrupt change in the submodel computing the response. Smooth
transitions create weighted combinations of submodel responses that change continuously with
the value of the threshold variable, and state changes indicate a shift in the dominant
submodel. For more details, see tsVAR.
Version History
Introduced in R2021b