fdesign.arbmagnphase
Arbitrary response magnitude and phase filter specification object
Syntax
d = fdesign.arbmagnphase

d = fdesign.arbmagnphase(specification)

d = fdesign.arbmagnphase(specification,specvalue1,specvalue2,...)

d = fdesign.arbmagnphase(specvalue1,specvalue2,specvalue3)

d = fdesign.arbmagnphase(...,fs)
Description
d = fdesign.arbmagnphase constructs
an arbitrary magnitude filter specification object d.
d = fdesign.arbmagnphase(specification) initializes
the Specification property for specifications
object d to specification. The
input argument specification must be one of the
choices shown in the following table. Specification options are not
case sensitive.
Specification | Description of Resulting Filter |
|---|---|
| Single band design (default). FIR and IIR ( |
| FIR multiband design where |
| IIR single band design. |
The following table describes the specification arguments.
Argument | Description |
|---|---|
| Number of bands in the multiband filter. |
| Frequency vector. Frequency values specified in |
| Complex frequency response values. |
| Filter order for FIR filters and the numerator and denominator
orders for IIR filters (when not specified by |
| Numerator order for IIR filters. |
| Denominator order for IIR filter designs. |
By default, this method assumes that all frequency specifications are supplied in normalized frequency.
Specifying f and h
f and h are the input
arguments you use to define the filter response desired. Each frequency
value you specify in f must have a corresponding
response value in h. This example creates a filter
with two passbands (b = 4) and shows how f and h are
related. This example is for illustration only. It is not an actual
filter.
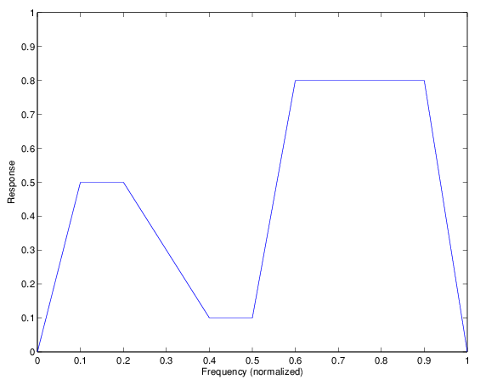
Define the frequency vector f as [0
0.1 0.2 0.4 0.5 0.6 0.9 1.0]
Define the response vector h as [0
0.5 0.5 0.1 0.1 0.8 0.8 0]
These specifications connectf and h as
shown in the following table.
f (Normalized Frequency) | h (Response Desired at f) |
|---|---|
0 | 0 |
0.1 | 0.5 |
0.2 | 0.5 |
0.4 | 0.1 |
0.5 | 0.1 |
0.6 | 0.8 |
0.9 | 0.8 |
1.0 | 0.0 |
A response with two passbands—one roughly between 0.1
and 0.2 and the second between 0.6 and 0.9—results from the
mapping between f and h. Plotting f and h yields
the following figure that resembles a filter with two passbands.
The second example in Examples shows this plot in more detail
with a complex filter response for h. In the example, h uses
complex values for the response.
Different specification types often have different design methods
available. Use designmethods(d) to
get a list of design methods available for a given specification option
and specifications object.
d = fdesign.arbmagnphase(specification,specvalue1,specvalue2,...) initializes
the filter specification object with specvalue1, specvalue2,
and so on. Use get(d,'description') for descriptions
of the various specifications specvalue1, specvalue2,
...specn.
d = fdesign.arbmagnphase(specvalue1,specvalue2,specvalue3) uses
the default specification option n,f,h, setting
the filter order, filter frequency vector, and the complex frequency
response vector to the values specvalue1, specvalue2,
and specvalue3.
d = fdesign.arbmagnphase(...,fs) specifies
the sampling frequency in Hz. All other frequency specifications are
also assumed to be in Hz when you specify fs.
Examples
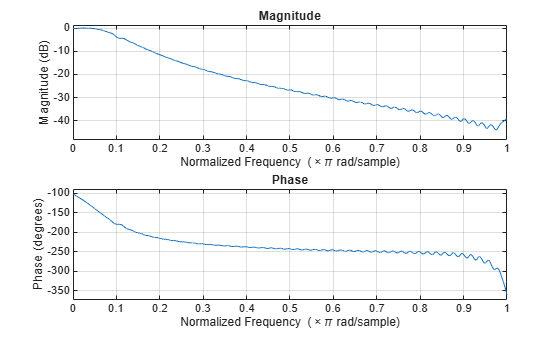
Use fdesign.arbmagnphase to model a complex analog filter.
d = fdesign.arbmagnphase('n,f,h',100); % N=100, f and h set to defaults.
anaFilt = design(d,'freqsamp',SystemObject=true)
anaFilt =
  dsp.FIRFilter with properties:

            Structure: 'Direct form'
      NumeratorSource: 'Property'
            Numerator: [0.0030 - 0.0053i 0.0667 - 0.0983i 0.0464 - 0.2758i -0.1387 - 0.2996i -0.2135 - 0.1145i -0.0911 + 0.0239i 0.0320 - 0.0100i 0.0209 - 0.0724i -0.0216 - 0.0461i -0.0011 + 0.0021i 0.0379 - 0.0070i 0.0262 - 0.0360i … ] (1×101 double)
    InitialConditions: 0

  Show all properties
freqz(anaFilt)
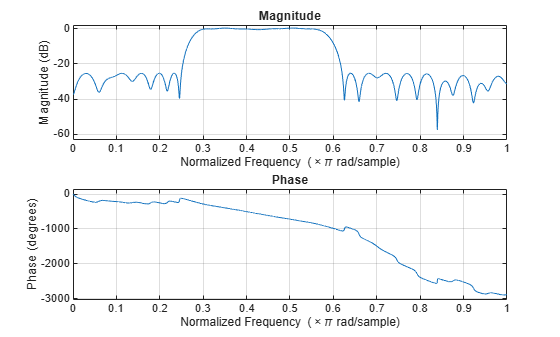
For a more complex example, design a bandpass filter with low group delay by specifying the desired delay and using f and h to define the filter bands.
n = 50;     % Group delay of a linear phase filter would be 25.
gd = 12;    % Set the desired group delay for the filter.
f1=linspace(0,.25,30); % Define the first stopband frequencies.
f2=linspace(.3,.56,40);% Define the passband frequencies.
f3=linspace(.62,1,30); % Define the second stopband frequencies.
h1 = zeros(size(f1));  % Specify the filter response at the freqs in f1.
h2 = exp(-1j*pi*gd*f2); % Specify the filter response at the freqs in f2.
h3 = zeros(size(f3));  % Specify the response at the freqs in f3.
d=fdesign.arbmagnphase('n,b,f,h',50,3,f1,h1,f2,h2,f3,h3);
D = design(d,'equiripple',SystemObject=true);
freqz(D)
Version History
Introduced in R2011a
See Also
fdesign | design | designmethods | setspecs