computeBoundaryModel
Compute lane boundary points from clothoid lane boundary model
Description
Examples
Create clothoid curves to represent left and right lane boundaries. Then, plot the curves.
Create the left boundary.
lb = clothoidLaneBoundary('BoundaryType','Solid', ...
'Strength',1,'Width',0.2,'CurveLength',40, ...
'Curvature',-0.8,'LateralOffset',2,'HeadingAngle',10);
Create the right boundary with almost identical properties.
rb = lb;
rb.LateralOffset = -2;
Create a bird's-eye plot. Then, create the lane boundary plotters and plot the boundaries.
bep = birdsEyePlot('XLimits',[0 50],'YLimits',[-10 10]);
lbPlotter = laneBoundaryPlotter(bep,'DisplayName','Left-lane boundary','Color','r');
rbPlotter = laneBoundaryPlotter(bep,'DisplayName','Right-lane boundary','Color','g');
plotLaneBoundary(lbPlotter,lb)
plotLaneBoundary(rbPlotter,rb);
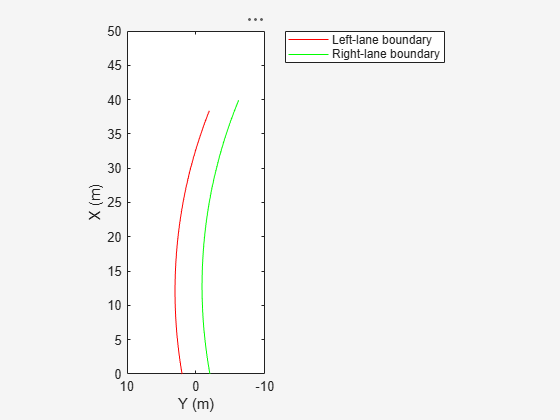
grid
hold on
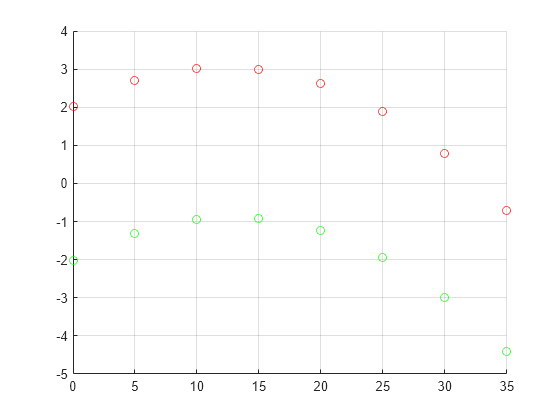
Plot the coordinates of selected points along the boundaries.
x = 0:5:50;
yl = computeBoundaryModel(lb,x);
yr = computeBoundaryModel(rb,x);
plot(x,yl,'ro')
plot(x,yr,'go')
hold off
Input Arguments
Output Arguments
Version History
Introduced in R2018a