Acquire Data from Multiple Channels and Multiple Devices
This example shows how to acquire data from multiple channels and
from multiple devices on the same chassis. In this example, you simultaneously acquire
voltage data from one channel of an NI 9201 device with ID cDAQ6Mod3
and two channels of an NI 9205 device with ID cDAQ6Mod1.
Create Interface to Acquisition Devices and Add Channels
Create a DataAcquisition
object. Add two analog input voltage channels for cDAQ6Mod1 with
channel IDs 0 and 1 using the addinput
function.
d = daq("ni");
addinput(d,"cDAQ6Mod1",0:1,"Voltage");
d.Channels
    Index   Type      Device      Channel   Measurement Type         Range              Name
    _____   ____    ___________   _______   ________________   __________________   _______________

      1     "ai"    "cDAQ6Mod1"   "ai0"     "Voltage (Diff)"   "-10 to +10 Volts"   "cDAQ1Mod1_ai0"
      2     "ai"    "cDAQ6Mod1"   "ai1"     "Voltage (Diff)"   "-10 to +10 Volts"   "cDAQ1Mod1_ai1"
Add an additional channel for a separate device, cDAQ6Mod3 with
channel ID 0. For NI devices, use either a terminal name, like ai0,
or a numeric equivalent like 0. Then view all channels on the
DataAcquisition object.
ch = addinput(d,"cDAQ6Mod3","ai0","Voltage");
d.Channels
    Index   Type      Device      Channel   Measurement Type         Range              Name
    _____   ____    ___________   _______   ________________   __________________   _______________

      1     "ai"    "cDAQ6Mod1"   "ai0"     "Voltage (Diff)"   "-10 to +10 Volts"   "cDAQ1Mod1_ai0"
      2     "ai"    "cDAQ6Mod1"   "ai1"     "Voltage (Diff)"   "-10 to +10 Volts"   "cDAQ1Mod1_ai1"
      3     "ai"    "cDAQ6Mod3"   "ai0"     "Voltage (Diff)"   "-10 to +10 Volts"   "cDAQ1Mod6_ai0"
You can now use d to acquire data from both devices
simultaneously, returned as either a matrix or a timetable.
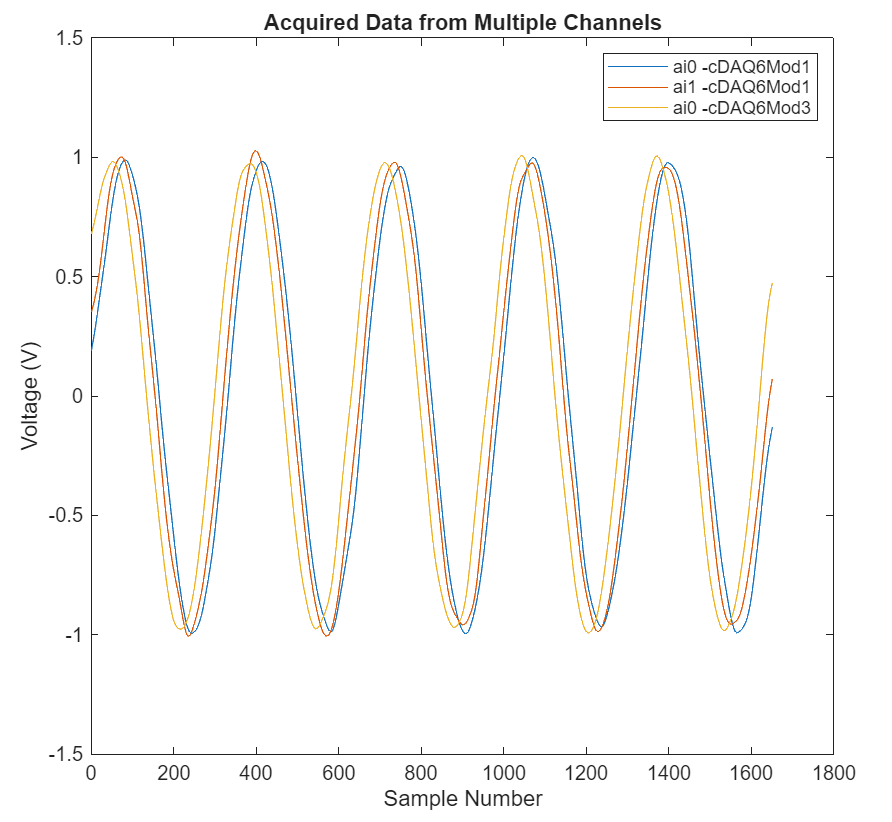
Acquire Data in Matrix Form and Plot Data from All Channels
Acquire data for a duration of one second. Store the acquired data as a matrix,
data, in which each column contains the data from one channel.
Then, plot all the data acquired from both devices.
data = read(d,seconds(1),OutputFormat="Matrix");
plot(data)
title("Acquired Data from Multiple Channels");
xlabel("Sample Number");
ylabel("Voltage (V)");
legend("ai0 -cDAQ6Mod1","ai1 -cDAQ6Mod1","ai0 -cDAQ6Mod3");
Acquire Data in Timetable Form
When you acquire data in timetable form, the software uses channel property
Name to identify channel data in the output. To see this effect,
change the name of the channel ai0 on cDAQ6Mod3
and view the channel properties. For more information, see Channel Properties.
ch.TerminalConfig = "SingleEnded";
ch.Name = "Velocity_sensor";
ch
ch =

 Index   Type     Device      Channel     Measurement Type           Range               Name
 _____   ____   ___________   _______   ____________________   __________________  _________________

   1     "ai"   "cDAQ6Mod3"   "ai0"     "Voltage (SingleEnd)"  "-10 to +10 Volts"  "Velocity_sensor"
Acquire data for a duration of one second and store it in the variable
data as a timetable.
data = read(d,seconds(1));
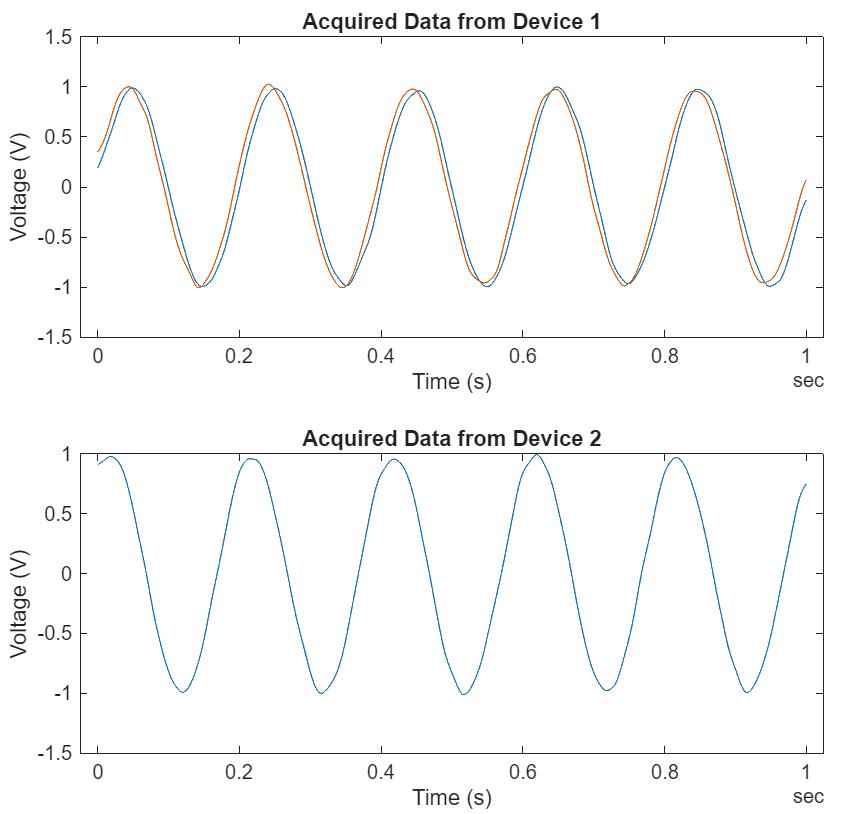
Plot Data from Each Device Separately
This time, instead of putting all the data from both devices on the same plot, use
two subplots: the first plot shows voltage signals from Device 1, and the second plot
shows the signal from Device 2. Use the channel name to specify which time series from
data to show in each plot.
figure;
tiledlayout(2,1);
nexttile
plot(data.Time,[data.cDAQ6Mod1_ai0 data.cDAQ6Mod1_ai1]);
title("Acquired Data from Device 1");
xlabel("Time (s)");
ylabel("Voltage (V)");
nexttile
plot(data.Time,data.Velocity_sensor);
title("Acquired Data from Device 2");
xlabel("Time (s)");
ylabel("Voltage (V)");