Input/Output Data for Identification
R2026bIdentification of a plant model for PID tuning requires a single-input, single-output data set.
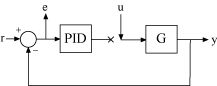
PID Tuner assumes that your measured data represents a plant connected to the PID controller in a negative-feedback loop. In other words, PID Tuner assumes that you injected a step signal at u and measured the system response at y, as shown in this figure.
For an example that shows how to identify a plant from measured data, see Interactively Estimate Plant Parameters from Response Data.
If you want to obtain input/output data by simulating a Simulink® model, PID Tuner lets you specify the shape of the input stimulus used to generate the response. For an example, see Design PID Controller Using Simulated I/O Data (Simulink Control Design).
To import response data, in PID Tuner, on the Plant Identification tab, under Get I/O Data, select one of these plant response types:
Step Response — Response to a specified step input signal
Impulse Response — Plant response to a specified impulse input signal
Wide Pulse Response — Response to a pulse of arbitrary rising and falling amplitudes
Arbitrary I/O Data — Response to an arbitrary input signal
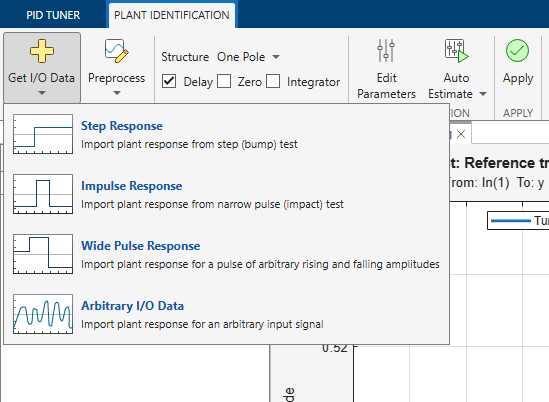
In the corresponding import dialog box, specify the input signal, output signal, and time vector for the response.
Input Signal
The input for your plant response is the signal injected at u.
When you specify the input signal for your response, configure the input signal to match the actual step input used when collecting the measured output data.
Step Input
For a step response, specify an input signal with a step change, as shown in the following figure.
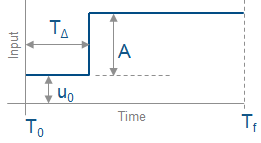
Configure the step signal by specifying these parameters.
Amplitude (A) — Enter the amplitude of the step input in any convenient units.
Offset (u0) — Enter the offset of the step input in the same units as the amplitude.
Onset Time (TΔ) — Enter the time at which the step stimulus occurs, specified in the units of your time vector.
Name — Enter a name for the input signal.
Impulse Input
For a step response, specify an input signal with an injected impulse, as shown in the following figure.
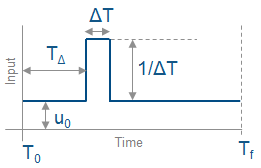
Configure the impulse signal by specifying these parameters.
Offset (u0) — Enter the offset of the impulse input in any convenient units.
Onset Time (TΔ) — Enter the time at which the impulse stimulus occurs, specified in the units of your time vector.
Name — Enter a name for the input signal.
Impulse Input
For a step response, specify an input signal with a wide pulse, as shown in the following figure.
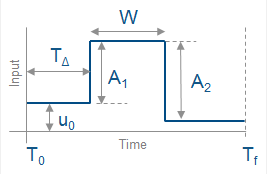
Configure the wide-pulse signal by specifying these parameters.
Rising Amplitude (A1) — Enter the amplitude of the leading edge of the pulse in any convenient units
Falling Amplitude (A2) — Enter the amplitude of the trailing edge of the pulse in the same units as the rising edge.
Pulse Width (W) — Enter the width of the pulse, specified in the units of your time vector.
Offset (u0) — Enter the offset of the impulse input in the same units as the amplitudes.
Onset Time (TΔ) — Enter the time at which the pulse occurs, specified in the units of your time vector.
Name — Enter a name for the input signal.
Arbitrary Input
To import arbitrary response data, specify one of these variables from the MATLAB® workspace:
A one-dimensional numeric vector of output data.
A
timeseriesobject containing one input signal. Thetimeseriesobject contains the time characteristics for the response.An
iddataobject containing one input signal. Typically, you specify the sameiddataobject as your output signal.
The length of the input signal must match the length of the output signal.
Specify a name for the output signal using the Name field.
You must also select the Intersample Behavior of the input signal using one of these values:
ZOH— Zero-order hold. The input signal is piecewise constant between samples.FOH— First-order hold. The input signal is linearly interpolated between samples.BL— Band-limited. A filtered input signal (an input of finite bandwidth) was used to excite the system dynamics. The corresponding continuous-time input signal has zero power above the Nyquist frequency.
If the input signal is an iddata object, the intersample
behavior is read from the InterSample property of the
object.
For more information about the effect of the input intersample behavior on identification, see Effect of Input Intersample Behavior on Continuous-Time Models (System Identification Toolbox).
Output Signal
The output for your plant response is the measured signal at y. When you import response data for any response type, define the output signal by specifying one of these variables from the MATLAB workspace:
A one-dimensional numeric vector of output data.
A
timeseriesobject containing one output signal. Thetimeseriesobject contains the time characteristics for the response.An
iddata(System Identification Toolbox) object containing one output signal. Theiddataobject contains the time characteristics for the response.
Also, specify a name for the output signal using the Name field.
Time Vector
The input and output data of your response must be sampled at regular intervals. You must specify the time data for your response.
When you specify the output signal as a numeric vector, specify these characteristics of the corresponding time vector:
Start Time (T0) — Enter the time at which the time vector begins, in the units specified in Units. This time is also the time of the first sample in the measured response data.
Sample Time (ΔT) — Enter the sampling interval.
Units — Select the units of the time vector.
When you specify the output signal as a timeseries or
iddata object, PID Tuner reads the time data from
that object.
Data Preprocessing
PID Tuner lets you preprocess your imported or simulated data. PID Tuner provides various options for detrending, scaling, and filtering the data.
It is recommended to remove any equilibrium-related signal offsets from the input and output signals before estimating the plant. You can also filter the data to focus the signal contents to a frequency band of interest.
Some data processing actions can alter the nature of the data, which can result in transient data (step, impulse, or wide pulse responses) to be treated as arbitrary input/output data. When that happens the identification plot does not show markers for adjusting the model time constants and damping coefficient.
For an example that includes a data-preprocessing step, see: Interactively Estimate Plant Parameters from Response Data.
For more information about data-preprocessing options, see Preprocess Data.

