Create Java Application with Multiple MATLAB Functions
This example shows how to create a Java® application that uses multiple MATLAB® functions to analyze a signal and then graph the result.
In this example, you perform the following steps:
Use MATLAB Compiler SDK™ to create a package containing a class that has a private method that is automatically encapsulated.
Access the MATLAB functions in a Java application, including use of the
MWArrayclass hierarchy to represent data.Build and run the application.
spectralanalysis Application
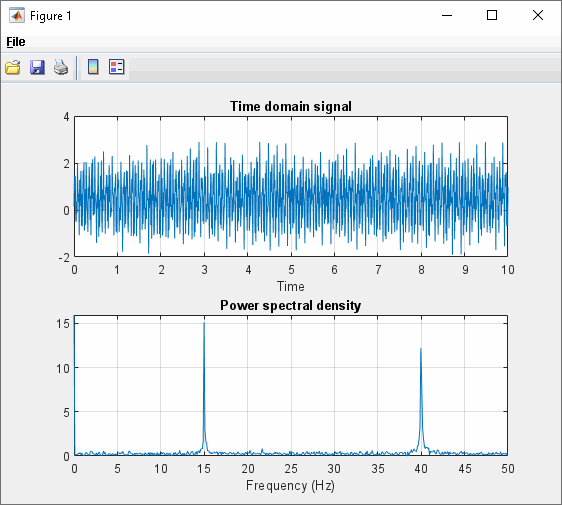
The spectralanalysis application analyzes a signal and graphs the
result. The class fourier performs a fast Fourier transform (FFT) on
an input data array. A method of this class, computefft, returns the
results of that FFT as two output arrays—an array of frequency points and the
power spectral density.
The second method, plotfft, graphs the returned data. These two
methods, computefft and plotfft, encapsulate
MATLAB functions.
Files
| MATLAB Functions | computefft.mplotfft.m |
| MATLAB Function Location | |
| Java Code Location | |
Procedure
Copy the
SpectraExamplefolder that ships with MATLAB to your work folder:copyfile(fullfile(matlabroot,'toolbox','javabuilder','Examples','SpectraExample'),'SpectraExample')
At the MATLAB command prompt, navigate to the new
SpectraExample\SpectraDemoCompsubfolder in your work folder.Examine the MATLAB functions
computefft.mandplotfft.m.Build the Java package with the Java Package Compiler app or
compiler.build.javaPackage.Use the following information for your project:
Project Name spectralanalysisClass Name fourierFile to Compile plotfft.mNote
In this example, the application that uses the
fourierclass does not callcomputefftdirectly. Thecomputefftmethod is required only by theplotfftmethod. You do not need to manually add thecomputefftfunction to the package, as the compiler automatically includes it during dependency analysis.For example, if you are using
compiler.build.javaPackage, type:buildResults = compiler.build.javaPackage('plotfft.m', ... 'PackageName','spectralanalysis', ... 'ClassName','fourier');
For more details, see the instructions in Generate Java Package and Build Java Application.
Write source code for a Java application that accesses the MATLAB functions.
The sample application for this example is in
SpectraExample\SpectraDemoJavaApp\powerspect.java.The program does the following:
Constructs an input array with values representing a random signal with two sinusoids at 15 and 40 Hz embedded inside of it
Creates an
MWNumericArrayarray that contains the datadata = MWNumericArray.newInstance(dims, MWClassID.DOUBLE, MWComplexity.REAL);
Instantiates a
fourierobjectCalls the
plotfftmethod, which callscomputefttand plots the dataUses a
try-catchblock to handle exceptionsFrees native resources using
MWArraymethods
In MATLAB, navigate to the
SpectraDemoJavaAppfolder.Copy the generated
spectralanalysis.jarpackage into this folder. For example, if you usedcompiler.build.javaPackage, type:copyfile(fullfile('..','SpectraDemoComp','spectralanalysisjavaPackage','spectralanalysis.jar'))
Open a command prompt window and navigate to the
SpectraDemoJavaAppfolder.Compile the
powerspect.javaapplication usingjavac.On Windows®, execute the following command:
javac -classpath "<matlabroot>\toolbox\javabuilder\jar\javabuilder.jar";.\spectralanalysis.jar powerspect.java
On UNIX®, execute the following command:
javac -classpath "<matlabroot>/toolbox/javabuilder/jar/javabuilder.jar":./spectralanalysis.jar powerspect.java
Replace
matlabrootC:\Program Files\MATLAB\R2025b.Run the
powerspectapplication.On Windows, execute the following command:
java -classpath .;"matlabroot\toolbox\javabuilder\jar\javabuilder.jar";.\spectralanalysis.jar powerspect
On UNIX, execute the following command:
java -classpath .:"matlabroot/toolbox/javabuilder/jar/javabuilder.jar":./spectralanalysis.jar powerspect
Note
If you are running the application on the Mac 64-bit platform, you must add the
-d64flag in the Java command.The
powerspectprogram displays the following output:
See Also
compiler.build.javaPackage | Java Package
Compiler
