Run Polyspace Analysis on Code Generated from Simulink Model
This tutorial shows how to run a Polyspace® analysis on C/C++ code generated from a Simulink® model. You can also analyze C/C++ code generated from a subsystem. For the complete workflow, see Run Polyspace Analysis on Code Generated with Embedded Coder.
Prerequisites
Before you run Polyspace from Simulink, you must link your Polyspace and MATLAB® installations. See Integrate Polyspace with MATLAB and Simulink.
To open the model used in this example, in the MATLAB Command Window, run:
openExample('polyspace_code_prover/OpenSimulinkModelForPolyspaceAnalysisExample')Open Simulink Model for Polyspace Analysis
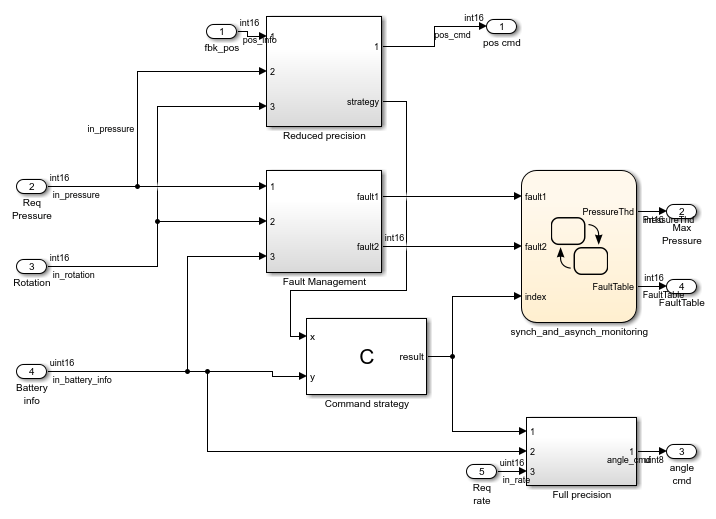
Open the model polyspace_controller_demo.
Check for Run-Time Errors in Generated Code
On the Apps tab, select Polyspace Code Verifier. The Polyspace tab opens.
On the Polyspace tab, select Code Prover in the Mode section.
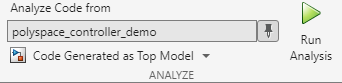
Locate the Analyze section and select Code Generated as Top model from the drop-down list.
Click Run Analysis. Polyspace checks if the model has been changed since the last code generation. If the generated code is up-to-date, Polyspace starts the analysis. If the generated code is not up-to-date or if there is no generated code, Polyspace generates the code first and then starts the analysis.
Alternatively, to start the analysis from the MATLAB Command Window, enter:
% Load model
load_system('polyspace_controller_demo');
% Generate code
slbuild('polyspace_controller_demo');
% Create Polyspace options object
mlopts = pslinkoptions('polyspace_controller_demo');
% Specify result folder
mlopts.ResultDir ='\cp_result';
% Set analysis to Code Prover mode
mlopts.VerificationMode = 'CodeProver';
% Run analysis
pslinkrun('polyspace_controller_demo', mlopts);
pslinkoptions and pslinkrun.Review Analysis Results
After the analysis completes, the analysis results appear in the Polyspace Platform user interface. Click Review in the toolstrip to open the result list view. The results consist of color coded checks:
Green: The check appear on proven code that does not fail for the data constraints provided. For instance, a division operation does not cause a Division by Zero error.
Red: The check appear on a verified error that always fails for the set of data constraints provided. For instance, a division operation always causes a Division by Zero error.
Orange: The check indicates a possible error in unproven code that can fail for certain values of the data constraints provided. For instance, a division operation sometimes causes a Division by Zero error.
Gray: The check indicates a code operation that cannot be reached for the data constraints provided.
Review each result in detail. In your Code Prover results:
On the Results List pane, locate the red Illegally dereferenced pointer check. Click the red check (
 ).
).On the Source pane, place your cursor on the flagged token. Polyspace displays tooltips with additional information about the result. The Result Details pane also provides this information.
The red check occur in the handwritten C code in the C Function block Command_Strategy.
Trace and Fix Issues in the Model
Issues reported by Polyspace on generated code might be caused by issues in the model. Trace an issue back to your model to investigate the root cause. Issues in code might occur due to a design issue such as:
Faulty scaling, unknown calibrations, and untested data ranges coming out of a subsystem into an arithmetic block.
Saturations leading to unexpected data flow inside the generated code.
Faulty programming in custom code blocks such as the C Function and Stateflow blocks.
To fix design issues in the example model, identify the root cause of run-time errors reported by Polyspace:
Illegally dereferenced pointer
On the Results List pane, select the Illegally dereferenced pointer check.
On the Result Details pane, click Go To Model ().
The Simulink Editor highlights the C Function block from which this error arises. In this block, the pointer p is incremented 100 times, pointing *p outside the bound of array. The dereferencing operation in rtb_x = (int16_T)(*p + 5); then causes a red Illegally dereferenced pointer check.
One solution for this error is to point *p to a valid memory location after the for loop in the C Function block:
// After the for loop, point p to a valid memory location
p = &(array[50]);
// ...
tmp = *p + 5;
Orange checks
The orange checks represent run-time errors that might occur in specific code execution path. Review the orange checks and triage the source of these potential issues. For instance:
Division by zero — This orange check is reported twice. One of these checks is reported in the statement
rtb_y1 = (int16_T)((int16_T)(10 * 10) / (int16_T)(10 - rtb_x)). Trace the cause of this issue by clicking Go To Model (). The Simulink Editor highlights the Divide block. In the execution paths where the÷input equals zero, the division operation results in a Division by zero error.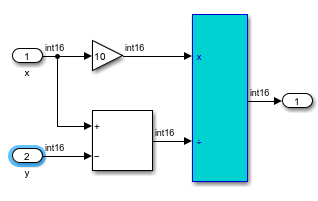
To resolve this error, check that the
÷input is not zero. For instance, use the If (Simulink) block and put the Divide block in an If Action Subsystem (Simulink).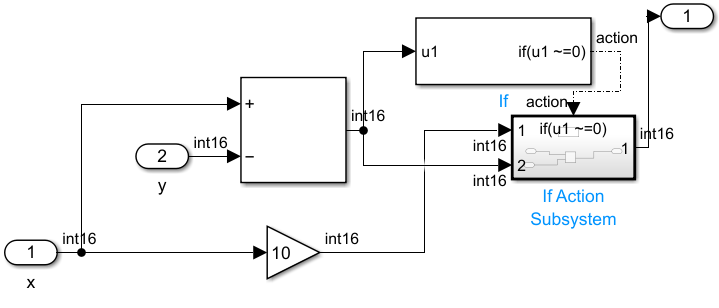
The other Division by zero checks can be resolved using similar techniques to check for a zero denominator.
Out of bound array index: This orange check is reported on the statement
polyspace_controller_demo_Y.FaultTable[*i] = 10;. For this result, the Go To Model () button is not available in the Results Details. In such cases, click the nearest link to model in the source code. For example, to trace the root cause of this potential error, click the link S4:76 in the comments preceding the orange error. The Simulink Editor highlights the Stateflow chartsynch_and_asynch_monitoring. Trace the error to the input variable index of the Stateflow® chart.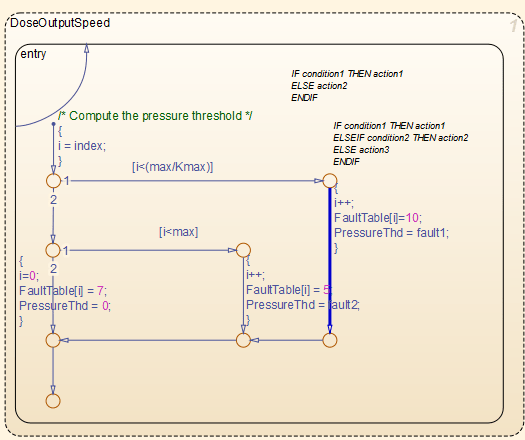
One solution to avoid this check is to constrain the input variable
index. Use a Saturation block before the Stateflow chart to limit the value ofindexfrom zero to100.Overflow: Polyspace reports several orange Overflow checks. Resolve these checks by constraining the inputs. For instance, consider the orange Overflow check in the statement
rtb_k = (int16_T)(((int16_T)((in_rotation + in_battery_info) >> 1) * 24576) >> 10). After you click Go To Model (), the Simulink Editor highlights the Gain block in theFault Managementsubsystem.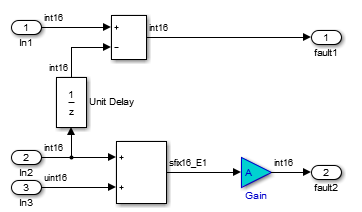
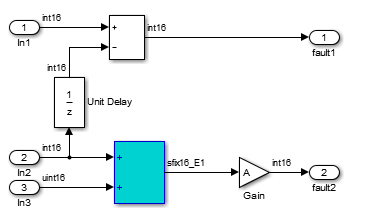
One solution to avoid the orange Overflow check is to constrain the value of the signal
in_battery_infothat is fed to the Sum block. For instance:Double-click the Inport block
Battery infothat provides the input signalin_battery_infoto the model.On the Signal Attributes tab, change the Maximum value of the signal to a lower value, such as
500.
Use this technique to address similar orange Overflow checks.
Check for Coding Rule Violations
To check for coding rule violations, start a Polyspace Bug Finder™ analysis.
On the Polyspace tab, select Settings > Project Settings and enable the MISRA C:2012 coding standard in the Coding Standards & Code Metrics node. Save the configuration and close the window.
In the Mode section, select Bug Finder.
Rerun the analysis.
Alternatively, in the MATLAB Command Window, enter:
% Enable checking for MISRA C:2012 violations
mlopts.VerificationSettings = 'PrjConfigAndMisraC2012';
% Specify separate folder for Bug Finder analysis
mlopts.ResultDir ='\bf_result';
% Set analysis to Bug Finder mode
mlopts.VerificationMode = 'BugFinder';
% Run analysis
pslinkrun('polyspace_controller_demo', mlopts);
Annotate Blocks to Justify Results
To justify Polyspace results, add annotations to your blocks. During code analysis, Polyspace populates the results with your justification. Once you justify a result, you do not have to review it again in subsequent analyses.
On the Results List pane, from the list in the upper-left corner, select File.
In the file
polyspace_controller_demo.c, in the functionpolyspace_controller_demo_step(), select the violation of MISRA C:2012 rule 10.4. The Source pane shows that an addition operation violates the rule.In the Results Details pane, add justification for this violation in the fields Severity, Status, and Comment. Set the Status to No action planned and the Severity to Unset
Copy the annotations to the Simulink block from which the violation arise by clicking Annotate Block ().
The words Polyspace annotation appear below the block, indicating that the block contains a code annotation.
Regenerate code and rerun the analysis. The Severity and Status columns on the Results List pane are now prepopulated with your annotations.