Speech Command Recognition Using Deep Learning
This example shows how to perform speech command recognition on streaming audio. The example uses a pretrained deep learning model. To learn how the deep learning model was trained, see Train Deep Learning Network for Speech Command Recognition.
Load the pre-trained network. The network is trained to recognize the following speech commands: yes, no, up, down, left, right, on, off, stop, and go, and to otherwise classify audio as an unknown word or as background noise.
load("SpeechCommandRecognitionNetwork.mat")
labels
labels = 1×12 categorical array
"down" "go" "left" "no" "off" "on" "right" "stop" "up" "yes" "unknown" "background"
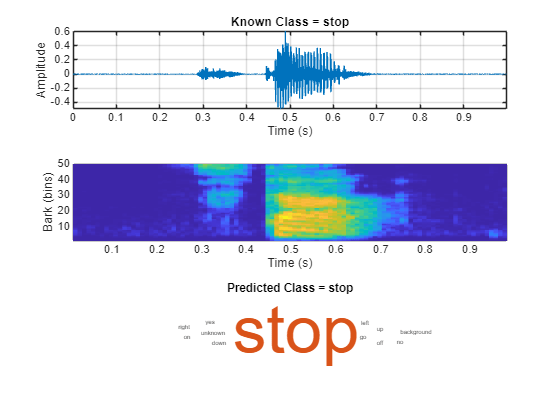
Load one of the following audio signals: noise, someone saying stop, or someone saying play. The word stop is recognized by the network as a command. The word play is an unknown word to the network. Listen to the signal.
audioData = {audioread("stopCommand.flac"),16e3,"stop"};
sound(audioData{1},audioData{2})
{audioread("stopCommand.flac"),16e3,"stop"};
sound(audioData{1},audioData{2})The pre-trained network takes auditory-based spectrograms as inputs. Use the supporting function extractAuditorySpectrogram to extract the spectrogram. Classify the audio based on its auditory spectrogram.
auditorySpectrogram = extractAuditorySpectrogram(audioData{1},audioData{2});
score = predict(net,auditorySpectrogram);
prediction = scores2label(score,labels,2);
Use the supporting function visualizeClassificationPipeline, to plot the audio signal, the auditory spectrogram, the network prediction, and a word cloud indicating the prediction scores.
visualizeClassificationPipeline(audioData,net,labels)
Detect Commands from Streaming Audio
The model was trained to classify auditory spectrograms that correspond to 1-second chunks of audio data. It has no concept of memory between classifications. To adapt this model for streaming applications, you can add logic to build up decision confidence over time.
Create a 9-second long audio clip of the background noise, the unknown word, and the known command.
fs = 16e3;
audioPlay = audioread("playCommand.flac");
audioStop = audioread("stopCommand.flac");
audioBackground = 0.02*pinknoise(fs);
audioIn = repmat([audioBackground;audioPlay;audioStop],3,1);
Specify the classification rate in hertz. The classification rate is the number of classifications per second. Every classification requires 1 second of audio data.
classificationRate =20; % Hz
Specify the time window for decisions. Decisions are made by considering all individual classifications in a decision time window.
decisionTimeWindow =1.5; % seconds
Specify thresholds for the decision logic. The frameAgreementThreshold is the percent of frames within a decisionTimeWindow that must agree to recognize a word. The probabilityThreshold is the threshold that at least one of the classification probabilities in the decisionTimeWindow must pass.
frameAgreementThreshold =50; % percent probabilityThreshold =
0.7;
Use the supporting function, detectCommands, to simulate streaming command detection. The function uses your default audio device to play the streaming audio.
detectCommands( ...
    Input=audioIn, ...
    SampleRate=fs, ...
    Network=net, ...
    Labels=labels, ...
    ClassificationRate=classificationRate, ...
    DecisionTimeWindow=decisionTimeWindow, ...
    FrameAgreementThreshold=frameAgreementThreshold, ...
    ProbabilityThreshold=probabilityThreshold);


Detect Commands from Microphone Input
You can test the model by performing speech command recognition on data input from your microphone. In this case, audio is read from your default audio input device. The TimeLimit parameter controls the duration of the audio recording. You can end the recording early by closing the scopes.
The network is trained to recognize the following speech commands: yes, no, up, down, left, right, on, off, stop, and go, and to otherwise classify audio as an unknown word or as background noise.
detectCommands( ... SampleRate=fs, ... Network=net, ... Labels=labels, ... ClassificationRate=20, ... DecisionTimeWindow=
1.5, ... FrameAgreementThreshold=
50, ... ProbabilityThreshold=
0.7, ... TimeLimit=
10);


Supporting Functions
Extract Auditory Spectrogram
Compute a Bark spectrogram from an audio signal as shown in Train Deep Learning Network for Speech Command Recognition. The audio input should be a mono audio signal with a duration of one second.
function features = extractAuditorySpectrogram(x,fs)

% Design audioFeatureExtractor object
persistent afe segmentSamples
if isempty(afe)
    designFs = 16e3;
    segmentDuration = 1;
    frameDuration = 0.025;
    hopDuration = 0.01;

    numBands = 50;
    FFTLength = 512;

    segmentSamples = round(segmentDuration*designFs);
    frameSamples = round(frameDuration*designFs);
    hopSamples = round(hopDuration*designFs);
    overlapSamples = frameSamples - hopSamples;

    afe = audioFeatureExtractor( ...
        SampleRate=designFs, ...
        FFTLength=FFTLength, ...
        Window=hann(frameSamples,"periodic"), ...
        OverlapLength=overlapSamples, ...
        barkSpectrum=true);
    setExtractorParameters(afe,"barkSpectrum",NumBands=numBands,WindowNormalization=false);
end

% Resample to 16 kHz if necessary
if double(fs)~=16e3
    x = cast(resample(double(x),16e3,double(fs)),like=x);
end

% Ensure the input is equal to 1 second of data at 16 kHz.
x = resize(x,segmentSamples,Side="both");

% Extract features
features = extract(afe,x);

% Apply logarithm
features = log10(features + 1e-6);

end
Visualize Classification Pipeline
Displays the current audio data, the auditory spectrogram generated from the audio signal, and a word cloud of the prediction scores for each of the potential command words.
function visualizeClassificationPipeline(audioData,net,labels)

% Unpack audio data
audio = audioData{1};
fs = audioData{2};
knownlabel = audioData{3};

% Create tiled layout
tiledlayout(3,1)

% Plot audio signal in first tile
nexttile
plotAudio(audio,fs)
title("Known Class = "+knownlabel)

% Plot auditory spectrogram in second tile
nexttile
auditorySpectrogram = extractAuditorySpectrogram(audio,fs);
plotAuditorySpectrogram(auditorySpectrogram)

% Plot network predictions as word cloud in third tile
nexttile
scores = predict(net,auditorySpectrogram);
prediction = scores2label(scores,labels,2);
wordcloud(labels,scores)
title("Predicted Class = "+string(prediction))

    function plotAuditorySpectrogram(auditorySpectrogram)
        %plotAuditorySpectrogram Plot auditory spectrogram

        % extractAuditorySpectrogram uses 25 ms windows with 10 ms hops.
        % Create a time vector with instants corresponding to the center of
        % the windows
        t = 0.0125:0.01:(1-0.0125);

        bins = 1:size(auditorySpectrogram,2);

        pcolor(t,bins,auditorySpectrogram')
        shading flat
        xlabel("Time (s)")
        ylabel("Bark (bins)")

    end
    function plotAudio(audioIn,fs)
        %plotAudio Plot audio

        t = (0:size(audioIn,1)-1)/fs;
        plot(t,audioIn)
        xlabel("Time (s)")
        ylabel("Amplitude")
        grid on
        axis tight

    end
end
Plot Streaming Features
Apply the speech command recognition network on streaming audio input and visualize the results. Adjust the arguments to customize the classification and display options.
function detectCommands(options)

arguments
    options.SampleRate
    options.Network
    options.Labels
    options.ClassificationRate
    options.DecisionTimeWindow
    options.FrameAgreementThreshold
    options.ProbabilityThreshold
    options.Input = []
    options.TimeLimit = inf;
end

% Isolate the labels
labels = options.Labels;

if isempty(options.Input)
    % Create an audioDeviceReader to read audio from your microphone.
    adr = audioDeviceReader(SampleRate=options.SampleRate,SamplesPerFrame=floor(options.SampleRate/options.ClassificationRate));

    % Create a dsp.AsyncBuffer to buffer the audio streaming from your
    % microphone into overlapping segments.
    audioBuffer = dsp.AsyncBuffer(options.SampleRate);
else
    % Create a dsp.AsyncBuffer object. Write the audio to the buffer so that
    % you can read from it in a streaming fashion.
    audioBuffer = dsp.AsyncBuffer(size(options.Input,1));
    write(audioBuffer,options.Input);

    % Create an audioDeviceWriter object to write the audio to your default
    % speakers in a streaming loop.
    adw = audioDeviceWriter(SampleRate=options.SampleRate);
end

newSamplesPerUpdate = floor(options.SampleRate/options.ClassificationRate);

% Convert the requested decision time window to the number of analysis frames.
numAnalysisFrame = round((options.DecisionTimeWindow-1)*(options.ClassificationRate) + 1);

% Convert the requested frame agreement threshold in percent to the number of frames that must agree.
countThreshold = round(options.FrameAgreementThreshold/100*numAnalysisFrame);

% Initialize buffers for the classification decisions and scores of the streaming audio.
YBuffer = repmat(categorical("background"),numAnalysisFrame,1);
scoreBuffer = zeros(numel(labels),numAnalysisFrame,"single");

% Create a timescope object to visualize the audio processed in the
% streaming loop. Create a dsp.MatrixViewer object to visualize the
% auditory spectrogram used to make predictions.
wavePlotter = timescope( ...
    SampleRate=options.SampleRate, ...
    Title="...", ...
    TimeSpanSource="property", ...
    TimeSpan=1, ...
    YLimits=[-1,1], ...
    Position=[600,640,800,340], ...
    TimeAxisLabels="none", ...
    AxesScaling="manual");
show(wavePlotter)
specPlotter = dsp.MatrixViewer( ...
    XDataMode="Custom", ...
    AxisOrigin="Lower left corner", ...
    Position=[600,220,800,380], ...
    ShowGrid=false, ...
    Title="...", ...
    XLabel="Time (s)", ...
    YLabel="Bark (bin)");
show(specPlotter)

% Initialize variables for plotting
currentTime = 0;
colorLimits = [-1,1];

% Run the streaming loop.
loopTimer = tic;
while whileCriteria(loopTimer,options.TimeLimit,wavePlotter,specPlotter,options.Input,audioBuffer)

    if isempty(options.Input)
        % Extract audio samples from the audio device and add the samples to
        % the buffer.
        audioIn = adr();
        write(audioBuffer,audioIn);
    end

    % Read samples from the buffer
    y = read(audioBuffer,options.SampleRate,options.SampleRate - newSamplesPerUpdate);

    % Extract an auditory spectrogram from the audio
    spec = extractAuditorySpectrogram(y,options.SampleRate);

    % Classify the current spectrogram, save the label to the label buffer,
    % and save the predicted probabilities to the probability buffer.
    score = predict(options.Network,spec);
    YPredicted = scores2label(score,labels,2);
    YBuffer = [YBuffer(2:end);YPredicted];
    scoreBuffer = [scoreBuffer(:,2:end),score(:)];

    % Plot the current waveform and spectrogram.
    ynew = y(end-newSamplesPerUpdate+1:end);
    wavePlotter(ynew)
    specPlotter(spec')

    % Declare a detection and display it in the figure if the following hold:
    %   1) The most common label is not background.
    %   2) At least countThreshold of the latest frame labels agree.
    %   3) The maximum probability of the predicted label is at least probThreshold.
    % Otherwise, do not declare a detection.
    [YMode,count] = mode(YBuffer);
    maxProb = max(scoreBuffer(labels == YMode,:));
    if YMode == "background" || count < countThreshold || maxProb < options.ProbabilityThreshold
        wavePlotter.Title = "...";
        specPlotter.Title = "...";
    else
        wavePlotter.Title = string(YMode);
        specPlotter.Title = string(YMode);
    end

    % Update variables for plotting
    currentTime = currentTime + newSamplesPerUpdate/options.SampleRate;
    colorLimits = [min([colorLimits(1),min(spec,[],"all")]),max([colorLimits(2),max(spec,[],"all")])];
    specPlotter.CustomXData = [currentTime-1,currentTime];
    specPlotter.ColorLimits = colorLimits;

    if ~isempty(options.Input)
        % Write the new audio to your audio output device.
        adw(ynew);
    end
end
release(wavePlotter)
release(specPlotter)

    function tf = whileCriteria(loopTimer,timeLimit,wavePlotter,specPlotter,Input,audioBuffer)
        if isempty(Input)
            tf = toc(loopTimer)<timeLimit && isVisible(wavePlotter) && isVisible(specPlotter);
        else
            tf = audioBuffer.NumUnreadSamples > 0;
        end
    end
end