Plot Large Audio Files
This example shows how to plot large audio files in MATLAB®. The first section shows a simple way to read and plot all the data in an audio file. The next two sections show how to read and plot only the envelope of an audio file without loading the entire audio file into memory.
Plot Short Audio Files
Use the audioread function to read an 11 second MP3 audio file. The audioread function can support other file formats. For a full list of viable formats, see Supported File Formats for Import and Export.
filename = "RockDrums-48-stereo-11secs.mp3";
[y,fs] = audioread(filename);
Using the sample rate fs returned by audioread, create a duration vector t the same length as y to represent elapsed time.
t = seconds(0:1/fs:(size(y,1)-1)/fs);
The audio file contains a stereo signal. Plot the two channels of audio data y as a function of time t.
plot(t,y)
title(filename)
xlabel("Time")
ylabel("Amplitude")
legend("Channel 1", "Channel 2")
xlim("tight")
ylim([-1 1])

Plot Large Audio Files Using Audio Envelope
When the audio file is very long (hours or even several minutes), reading and plotting all the data in MATLAB might take significant time and memory resources. In such cases, you might not want to read all the data in MATLAB, if the only purpose is to visualize the waveform. You can use the audioEnvelope function to read an envelope of the audio file and plot only the overall envelope of the audio waveform.
filename = "SoftGuitar-44p1_mono-10mins.ogg";
auInfo = audioinfo(filename)
auInfo = struct with fields:
Filename: '/mathworks/devel/bat/filer/batfs2566-0/Bdoc26a.3233028/build/runnable/matlab/toolbox/audio/samples/SoftGuitar-44p1_mono-10mins.ogg'
CompressionMethod: 'Vorbis'
NumChannels: 1
SampleRate: 44100
TotalSamples: 26300000
Duration: 596.3719
Title: []
Comment: []
Artist: []
SoftGuitar-44p1_mono-10mins.ogg is approximately 10 minutes long, recorded at 44100 Hz, and contains 26.3 million audio samples.
Read the envelope of the audio signal in SoftGuitar-44p1_mono-10mins.ogg using the audioEnvelope function.
[envMin,envMax,loc] = audioEnvelope(filename,NumPoints=2000);
audioEnvelope returns envMin and envMax containing the minimum and maximum sample values over frames of length equal to floor(L/numPoints), where L is the length of the audio signal and numPoints is the number of points returned by audioEnvelope. Connect envMin and envMax at each point and plot them as a function of time t.
nChans = size(envMin,2);
envbars = [shiftdim(envMin,-1);
    shiftdim(envMax,-1);
    shiftdim(NaN(size(envMin)),-1)];
ybars = reshape(envbars,[],nChans);
t = seconds(loc/auInfo.SampleRate);
tbars = reshape(repmat(t,3,1),[],1);
plot(tbars,ybars);
title(filename,Interpreter="none")
xlabel("Time")
ylabel("Amplitude")
xlim("tight")
ylim([-1 1])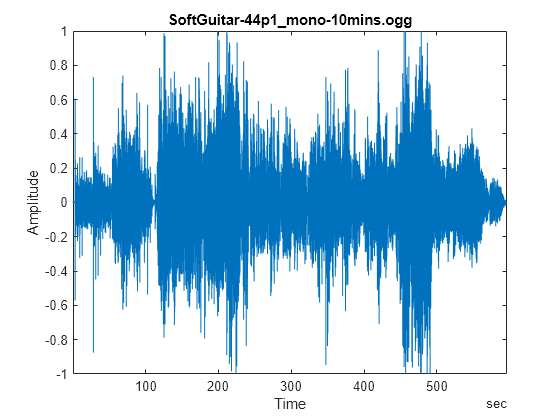
Plot Large Audio Files Using a Custom Chart
In the previous section, you plot the audio envelope of a 10-minute audio file using 2000 points. You can zoom and pan the plot above, but when you zoom in, it does not fetch more data.
This section introduces a new custom chart, audioplot, which plots any audio file using the audio envelope technique and also makes it interactive so that when you zoom or pan, the plot fetches more data from the audio file and updates the visual as needed. The custom chart audioplot is a subclass of the ChartContainer base class. By inheriting from the ChartContainer base class, instances of audioplot are members of the graphics object hierarchy and can be embedded in any MATLAB figure alongside other graphics objects. For more information, see Chart Development Overview.
audioplot displays audio data using two axes with interactive features. The top axes has panning and zooming enabled along the x dimension to help examine a region of interest. The bottom axes displays a plot over the entire time range along with a light blue time window, which indicates the display range in the top axes.
audioplot defines the following public properties:
AudioSource- A public and dependent property that stores the audio file name or a numeric array representing audio data.SampleRate- A public and dependent property that stores the sampling rate of the audio signal in hertz. This property is read-only when theAudioSourceproperty is an audio file name.DisplayLimits- A public property that sets the limits of the top axes and the width of the time window in the bottom axes.WaveformAxesandPannerAxes- Read-only properties that store the axes objects.
Use audioplot to plot the 10-minute long audio file SoftGuitar-44p1_mono-10mins.ogg.
filename = "SoftGuitar-44p1_mono-10mins.ogg";
ap = audioplot(filename);
