spectralKurtosis
Spectral kurtosis for signals and spectrograms
Syntax
Description
kurtosis = spectralKurtosis(x,f,Name=Value)
spectralKurtosis(___) with no output arguments plots
the spectral kurtosis.
If the input is in the time domain, the spectral kurtosis is plotted against time.
If the input is in the frequency domain, the spectral kurtosis is plotted against frame number.
Examples
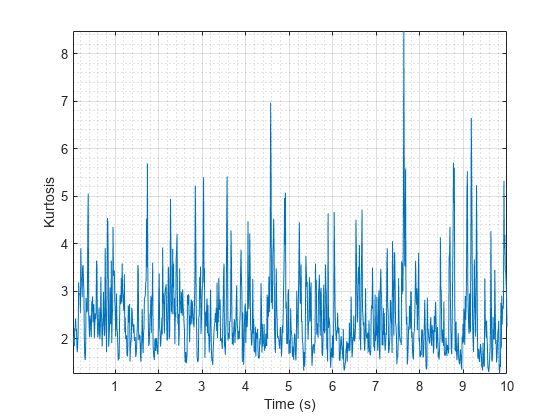
Spectral Kurtosis of Time-Domain Signal
Create a chirp signal with white Gaussian noise and calculate the kurtosis using default parameters.
fs = 1000;
t = (0:1/fs:10)';
f1 = 300;
f2 = 400;
x = chirp(t,f1,10,f2) + randn(length(t),1);

kurtosis = spectralKurtosis(x,fs);
Plot the spectral kurtosis against time.
spectralKurtosis(x,fs)
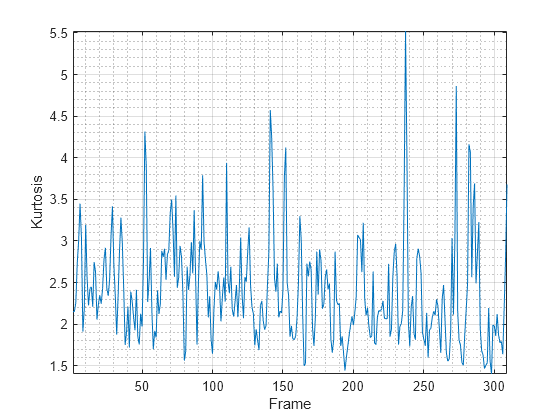
Spectral Kurtosis of Frequency-Domain Signal
Create a chirp signal with white Gaussian noise and then calculate the spectrogram using the stft function.
fs = 1000;
t = (0:1/fs:10)';
f1 = 300;
f2 = 400;
x = chirp(t,f1,10,f2) + randn(length(t),1);

[s,f] = stft(x,fs,FrequencyRange="onesided");
s = abs(s).^2;
Calculate the kurtosis of the spectrogram over time.
kurtosis = spectralKurtosis(s,f);
Plot the spectral kurtosis against the frame number.
spectralKurtosis(s,f)
Specify Nondefault Parameters
Create a chirp signal with white Gaussian noise.
fs = 1000;
t = (0:1/fs:10)';
f1 = 300;
f2 = 400;
x = chirp(t,f1,10,f2) + randn(length(t),1);
Calculate the kurtosis of the power spectrum over time. Calculate the kurtosis for 50 ms Hamming windows of data with 25 ms overlap. Use the range from 62.5 Hz to fs/2 for the kurtosis calculation.
kurtosis = spectralKurtosis(x,fs, ...
                      Window=hamming(round(0.05*fs)), ...
                      OverlapLength=round(0.025*fs), ...
                      Range=[62.5,fs/2]);
Plot the kurtosis against time.
spectralKurtosis(x,fs, ...
              Window=hamming(round(0.05*fs)), ...
              OverlapLength=round(0.025*fs), ...
              Range=[62.5,fs/2])

Input Arguments
Output Arguments
Algorithms
The spectral kurtosis is calculated as described in [1]:
where
fk is the frequency in Hz corresponding to bin k.
sk is the spectral value at bin k.
b1 and b2 are the band edges, in bins, over which to calculate the spectral skewness.
μ1 is the spectral centroid, calculated as described by the
spectralCentroid(Audio Toolbox) function.μ2 is the spectral spread, calculated as described by the
spectralSpread(Audio Toolbox) function.
References
[1] Peeters, G. "A Large Set of Audio Features for Sound Description (Similarity and Classification) in the CUIDADO Project." Technical Report; IRCAM: Paris, France, 2004.
Extended Capabilities
Version History
Introduced in R2019a
See Also
spectralCentroid (Audio Toolbox) | spectralSpread (Audio Toolbox) | spectralSkewness
Topics
- Spectral Descriptors (Audio Toolbox)
You can also select a web site from the following list:
Americas
- América Latina (Español)
- Canada (English)
- United States (English)
Europe
- Belgium (English)
- Denmark (English)
- Deutschland (Deutsch)
- España (Español)
- Finland (English)
- France (Français)
- Ireland (English)
- Italia (Italiano)
- Luxembourg (English)
- Netherlands (English)
- Norway (English)
- Österreich (Deutsch)
- Portugal (English)
- Sweden (English)
- Switzerland
- United Kingdom (English)