showMetalMesh
Description
showMetalMesh(___,Name=Value) displays the metal mesh,
with additional properties specified by one or more Name-Value Arguments.
Examples
This example shows how to read mesh parameters of a microstrip patch antenna and view the metal, dielectric, and complete mesh.
Create Microstrip Patch Antenna
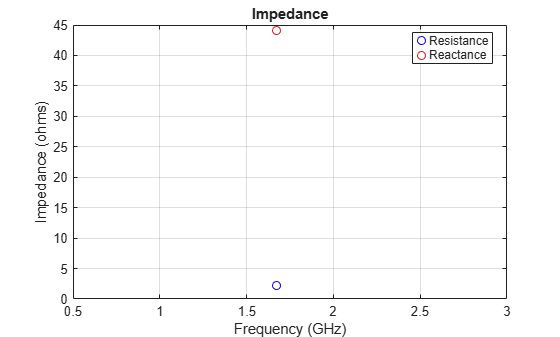
Create a microstrip patch antenna with copper conductor and FR4 PCB substrate. Run impedance analysis on this antenna at 1.67 GHz to automatically generate the mesh.
p = patchMicrostrip(Conductor=metal("Copper"), Substrate=dielectric("FR4"));
figure
impedance(p,1.67e9);
Read Mesh Parameters of Antenna
Read the mesh parameters such as number of points, triangles, and tetrahedra, maximum and minimum edge length, mesh growth rate, and quality using the MeshReader object.
m = mesh(p)
m =
  MeshReader with properties:

                Points: [3×1644 double]
             Triangles: [4×2013 double]
            Tetrahedra: [4×4617 double]
         MaxEdgeLength: 0.0044
         MinEdgeLength: 2.2012e-04
            GrowthRate: 0.9500
    MinimumMeshQuality: 0.0289
              MeshMode: 'auto'
View Mesh of Antenna
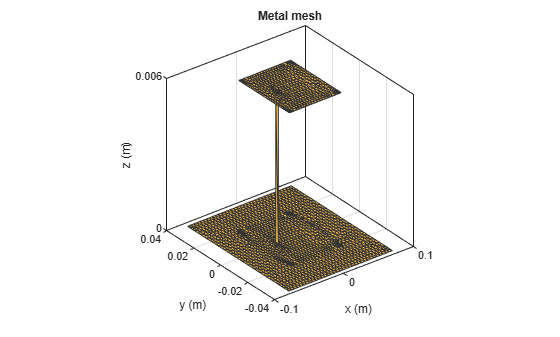
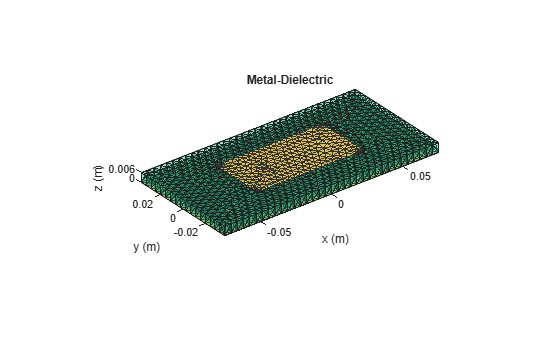
View the metal mesh.
figure
showMetalMesh(m)
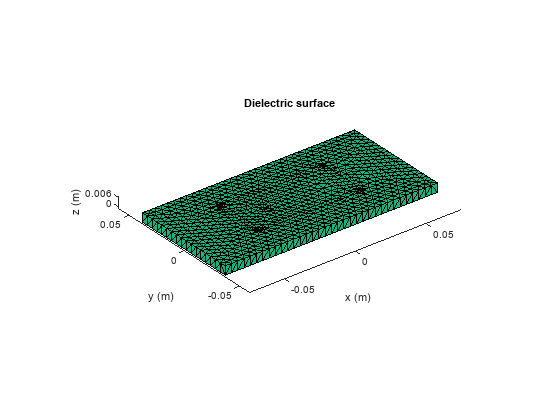
View the dielectric surface mesh.
figure
showDielectricSurfaceMesh(m)
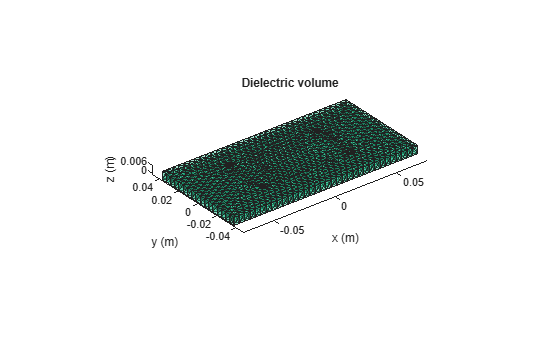
View the dielectric volume mesh.
figure
showDielectricVolumeMesh(m)
View the overall mesh.
figure
showMeshAll(m)
Input Arguments
Name-Value Arguments
Version History
Introduced in R2023b