Simulation Visualizations
System-level simulations model multinode networks with nodes modeling protocol stack that includes physical (PHY), medium access control (MAC), and radio link control (RLC) layers. You can model NR cells using the 5G Toolbox™ and evaluate the network performance with different MAC scheduling strategies and PHY algorithms. You can also measure metrics like throughput, scheduling fairness, block error rate (BLER), and spectrum efficiency, and use visualization capabilities to analyze the performance of the network.
This topic page explains the visualizations with respect to a sample 5G NR cell consisting of a set of user equipment nodes (UEs) connected to a gNB. These are some of the elements you can customize in a simulation.
Configuration parameters for each layer
Scheduling strategies
PHY layer — Abstract PHY layer or full PHY layer
Channel impairments
Visualizations
These run-time visualizations display the network performance metrics.
Cell Performance Metrics
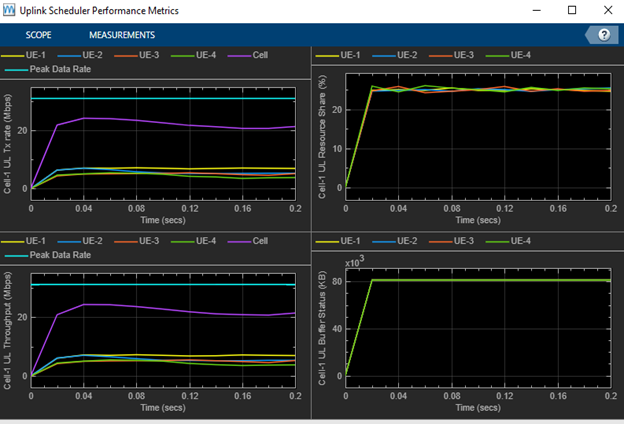
This figure includes four plots that display these uplink (UL) metrics.
UL transmission rate for each UE and the cell. This value represents the rate of MAC data transmission for each UE and across the cell. The calculation includes the transport block size of new transmissions and retransmissions. Units are in megabits per second (Mbps).
UL throughput for each UE and the cell. This value represents the rate of MAC data received successfully at the gNB from each UE and across the cell. Units are in Mbps.
Resource share percentage among the UEs with respect to the total UL resources. This value represents the fairness of UL scheduling.
Pending UL buffer status of the UEs to determine whether the UEs are getting sufficient resources.
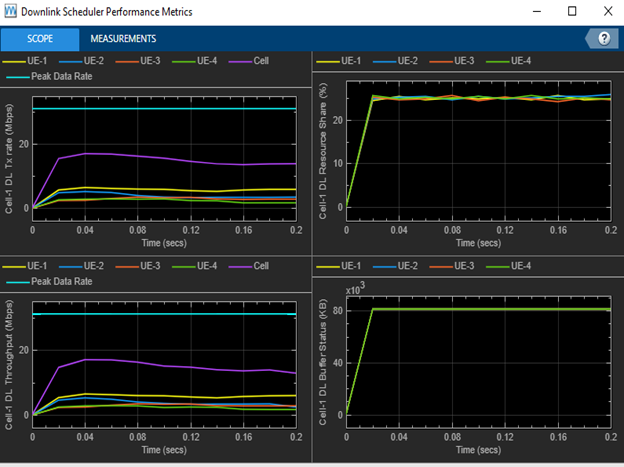
Similar to the UL metrics visualization, this figure includes identical plots that display the downlink (DL) metrics.
Set the NumMetricsSteps parameter to configure the number of times the plot updates for an entire simulation. These metrics plots update for every metricsStepSize slots, where metricsStepSize is equal to the total slots in the simulation time divided by numMetricsSteps.
Note
NumMetricsSteps parameter also configures the plot update times for RLC Metrics and Block Error Rate Metrics in an entire simulation.
The peak spectral efficiency value is calculated using the following formula:
where:
vlayers is the maximum number of layers.
Qm is the maximum modulation order.
f is the scaling factor and is assumed as 1.
Rmax = 948∕1024
is the maximum resource block (RB) allocation in the bandwidth with a subcarrier spacing of μ.
is the average orthogonal frequency division multiplexing (OFDM) symbol duration in a subframe.
OH is the overhead calculated as the average ratio of the number of occupied resource elements (REs) to the total number of REs in effective bandwidth time product. For these metrics visualizations, OH is assumed to be 0.
BW is the UE-supported maximum bandwidth in the given band.
For more information, refer to 3GPP TR 37.910 Section 5.1.1 [1].
The maximum achievable throughput corresponds to the numerator in the above formula and is shown with a dashed line in throughput.
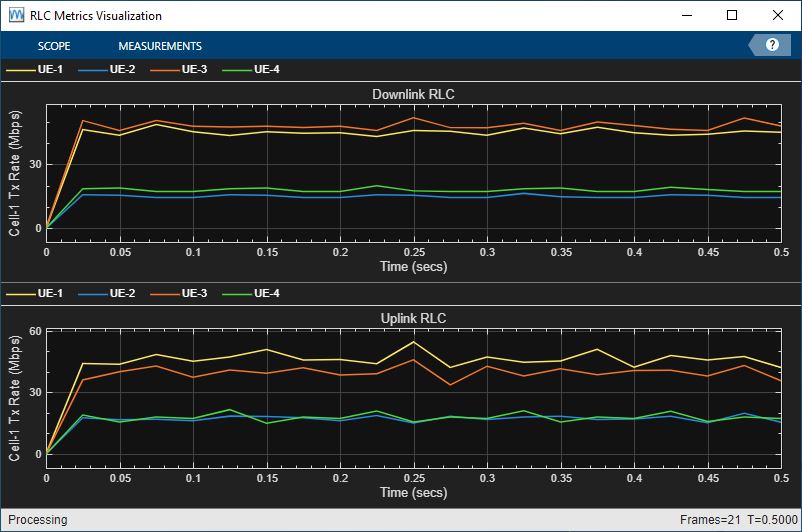
RLC Metrics
These two subplots show the number of bytes transmitted by the RLC layer for each UE
in the UL and DL direction, respectively. To toggle the display of the plot before the
start of a simulation, pass a value of 0 or 1 to the
PlotRLCMetrics name-value (N-V) argument of the
helperNRMetricsVisualizer constructor. A value of
1 enables this metrics plot. A value of 0 disables
this metrics plot.
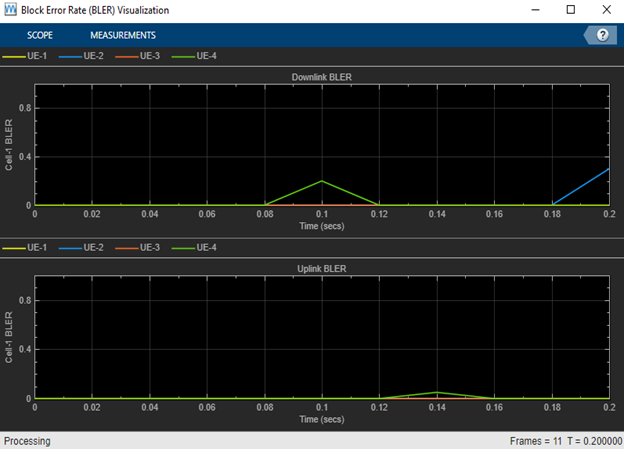
Block Error Rate Metrics
These two subplots show the block error rates (BLER) observed for each UE in the UL and DL direction, respectively. As described in Cell Performance Metrics section, NumMetricsSteps parameter configures the number of times the plot updates for an entire simulation.
To toggle the display of the plot before the start of a simulation, pass a value of
0 or 1 to the PlotPHYMetrics
N-V argument of the hNRMetricsVisualizer constructor. A value of
1 enables this metrics plot. A value of 0 disables
this metrics plot.
Resource Grid Allocation
This 2-D time-frequency grid shows the resource allocation to the UEs on a frame-by-frame basis. The hybrid automatic repeat request (HARQ) process for the physical uplink shared channel (PUSCH) and physical downlink shared channel (PDSCH) assignments is also shown alongside the radio network temporary identifier (RNTI) of the UEs. New transmissions are shown in black and retransmissions are shown in blue using the HARQ process ID of each UE. Using the HARQ ID, you can map a retransmission assignment to its previously failed transmission.
You can visualize the resource allocations for a selected RB range from the drop down present in the top left of the plot.
The plot is updated for each frame and shows the RB allocation to the UEs in the last complete frame.
To toggle the display of the plot before the start of a simulation, set the
ResourceGridVisualization N-V argument of the
helperNRGridVisualizerconstructor. A value of 1
enables this metrics plot. A value of 0 disables this metrics plot..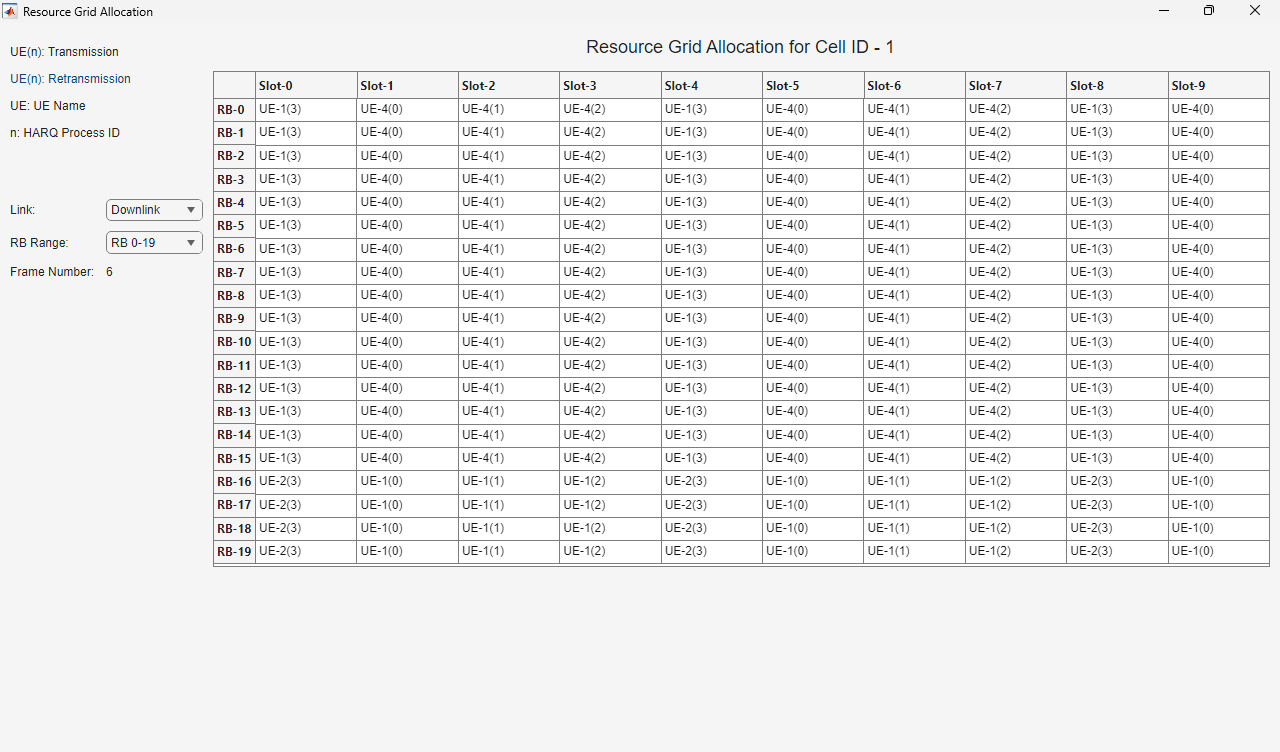
MCS Visualization
This figure shows the MCS visualization of UE nodes based on the grants allocated to them in the UL and DL. The plot is updated for each frame.
To toggle the display of the plot before the start of a simulation, pass a value of
0 or 1 to the
MCSGridVisualization N-V argument of the
helperNRGridVisualizer constructor. A value of -1 enables
this metrics plot. A value of 0 disables this metrics plot.
A value from 0 to 27 indicates the MCS used for
transmission in the RBs assigned to a particular UE. A value of -1
indicates RBs that are not assigned to that UE. 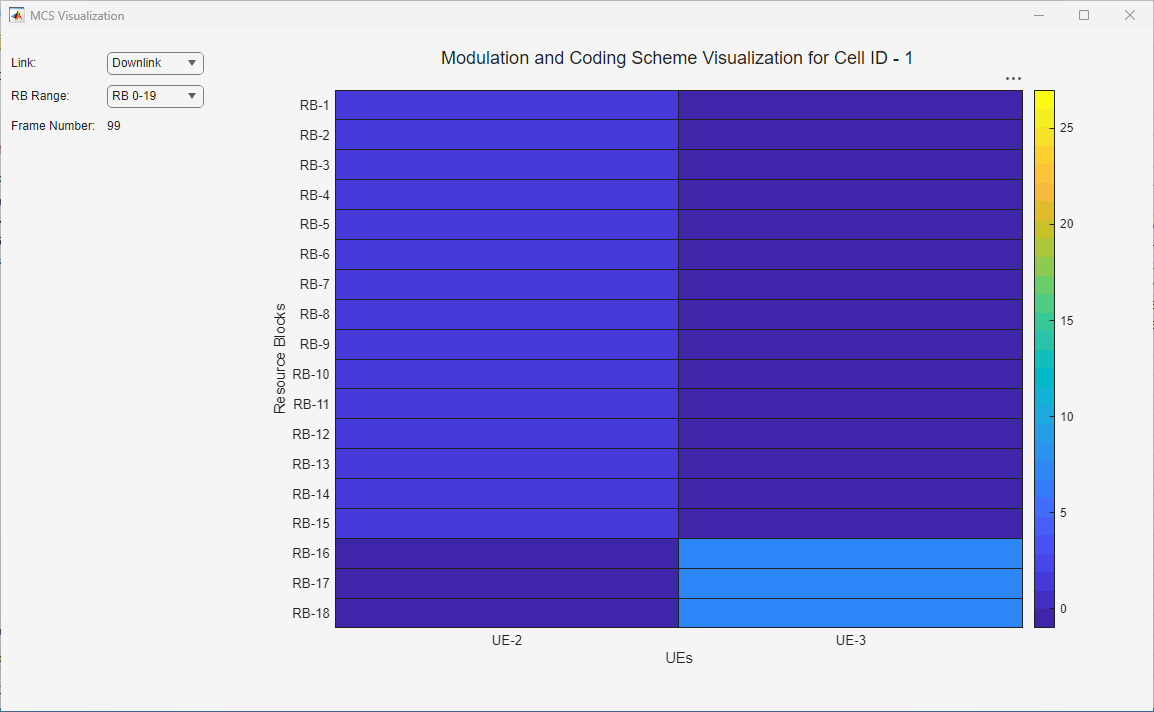
Results
At the end of the simulation, you can compare the achieved value for system performance indicators to their theoretical peak values considering zero overheads.
Performance indicators displayed in this sample result summary are achieved data rate
(UL and DL), achieved spectral efficiency (UL and DL), and BLER observed for UEs (DL and
UL). The peak values are calculated as per 3GPP TR 37.910 [1].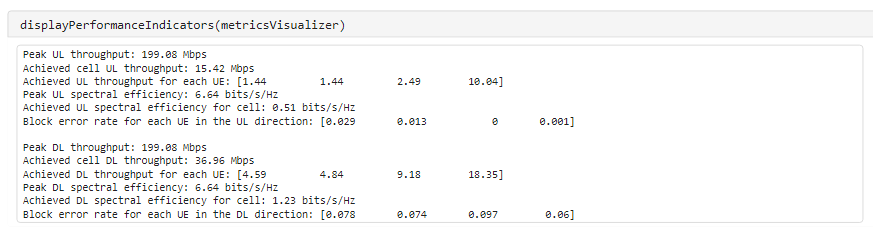
References
[1] 3GPP TR 37.910. “Study on self evaluation towards IMT-2020 submission.” 3rd Generation Partnership Project; Technical Specification Group Radio Access Network.