Alias blanks in the cell array as a string.
As the OP found, the solution is to include multiple delimiters strsplit(t,'\t', 'CollapseDelimiters',false) And as others hav...
mehr als ein Jahr vor | 1
| akzeptiert
Group Data for one Legend in Figure of Multiple SubPlots
Here are the key concepts to achieve this Use tiledlayout instead of subplot. Tiledlayout does a much better job at hosting gl...
mehr als ein Jahr vor | 1
| akzeptiert
How to read numeric data with different number of columns
Is this what you are looking for? file = "data.txt"; t = readtable(file, 'ReadRowNames',true,"Delimiter",'\t') The data file...
mehr als ein Jahr vor | 0
| akzeptiert
Understand values differences between smooth and smoothdata functions
> Is there a difference in window calculation between smooth and smoothdata for 'lowess' method These two functions compute the...
mehr als ein Jahr vor | 1
Unable to see uifigure object properties
Let's see if I understand your workflow. Please correct me if this summary is incorrect. rbBar and rbLine are defined in a fun...
mehr als ein Jahr vor | 0
Remove NaNs from uitable Matlab App
Can a UITable show missing values or NaNs as empty? Currently there is not an option to show missing or NaN values as empty in ...
mehr als ein Jahr vor | 2
| akzeptiert
Discussion
MATLAB Community gets shout-out in pod cast
Three former MathWorks employees, Steve Wilcockson, David Bergstein, and Gareth Thomas, joined the ArrayCast pod cast to discuss...
mehr als ein Jahr vor | 11
Veröffentlicht
Violin Plot: A Tool For Visualizing Distributions
Guest Writer: Baldvin Einarsson Baldvin is a software engineer in the Statistics and Machine Learning Toolbox. His...
mehr als ein Jahr vor

how to add geoplot scatter plot custom icon overlays?
If you're using MATLAB R2024b or later and have the Mapping Toolbox, use the new geoiconchart. lat = [37.7749, 34.0522, 40.7128...
mehr als ein Jahr vor | 2
How to rotate rectangular with a an angle?
MATLAB's polyshape has a rotate function that makes this fairly easy. Instead of the [left, bottom, width, height] input used i...
mehr als ein Jahr vor | 1
Superscripts and subscripts in fprintf
Not all letters have unicode subscripts but m, a, and x do, so you're in luck. x = 2; fprintf(1,'Maximum value of N is N%c%c%...
mehr als ein Jahr vor | 0
how to halt a for loop in an external function called from mlapp by using a stop button in the mlap app
> Do I need to pass in app.stopFlag as an argument with the function when I call it, I thought that making app.stopFlag public w...
mehr als ein Jahr vor | 0
Discussion
bubblechart + bar plot - graphics
Check out this 3D chart that won Visual Of The Year for 2024 by Visual Capitalist. It's a mashup between a 3D bubblechart and a...
mehr als ein Jahr vor | 3
Zoom of image on UIAxes seems to have one axis bound
Try setting the DataAspectRatio to [1 1 1] using axis(uiax,'equal'). If that doesn't fix the issue, it would help to share a ...
mehr als ein Jahr vor | 0
| akzeptiert
How to disable or delete cameratoolbar context menu
This stumped me for a bit but I've found a potential workaround. I'll also make a note of this issue for discussion. Workaroun...
mehr als ein Jahr vor | 0
Why is bootci giving different interval than prctile?
You're using two different alpha values. When you call bootci, you specify alpha as 0.05 or 5%. When you call prctile, you'...
mehr als ein Jahr vor | 1
| akzeptiert
What are All of the Variables in the Workspace on Answers?
Fixed! Thanks for reporting it. myvar = 5; whos
mehr als ein Jahr vor | 2
| akzeptiert
Veröffentlicht
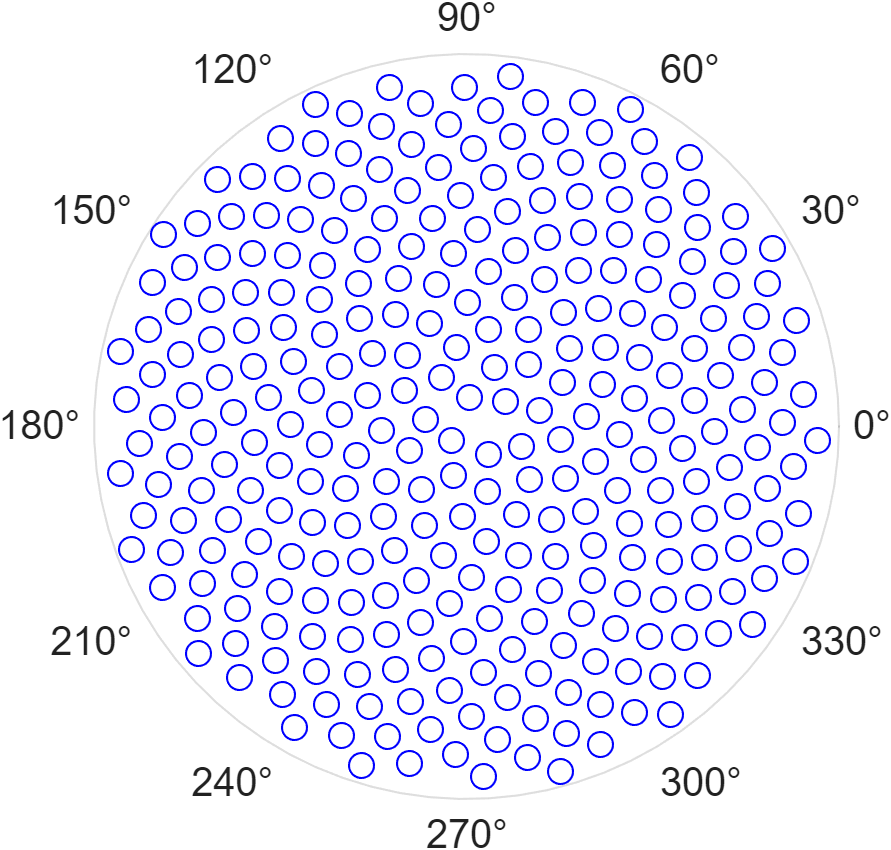
Pinecode: Creating pinecones with Fibonacci spirals
Today we explore phyllotactic spirals, a naturally emerging pattern found in densely packed plant structures such as...
mehr als ein Jahr vor
Copy/Paste from ListBox at runtime
Add a right-click "copy" option to ListBox Create a context menu for the list box and set its MenuSelectedFcn to use clipboard...
mehr als ein Jahr vor | 1
| akzeptiert
Veröffentlicht
Share your Apps with MATLAB Online and Focused View: A Pumpkin Example
Guest Writer: Eric Ludlam Today Eric Ludlam shares three steps to share your app with others using a hyperlink. Eric is...
mehr als ein Jahr vor

Automatic line selection bug
Ensure that your mouse button isn't stuck. I haven't seen this issue but if it continues to occur after closing and reopening M...
mehr als ein Jahr vor | 0
Cannot Open any MLAPP with axes
This appears to be the same issue as in the thread Saurabh mentioned. If you want to try to fix this yourself I suggest you cre...
mehr als ein Jahr vor | 1
Where can I get a matlab coffee cup?
Check out the new MathWorks Merch Shop: https://mathworksmerch.com/ Announcement: https://blogs.mathworks.com/community/2024/11...
mehr als ein Jahr vor | 4
when I move the plot, the text is not displayed outside the plot itself
When you create the text labels, set clipping to on. text(___,'Clipping','on')
mehr als ein Jahr vor | 0
| akzeptiert
Is there any way to add a set of random punctual z values labels inside the plot using a contourf x, y, z command?
Add a set of random z value labels inside a contourf plot This demo shows the following. Define x (vector), y (vector), and z...
mehr als ein Jahr vor | 0
| akzeptiert
Serial: Real-time plotting and storaging streaming data from Arduino slowing down badly over time
Calling plot(__) with hold on in a loop is inefficient. Every time new points are added to the axes, new line objects are creat...
mehr als ein Jahr vor | 0
Discussion
Find unsuppressed outputs in R2024b using dbstop
It's frustrating when a long function or script runs and prints unexpected outputs to the command window. The line producing th...
mehr als ein Jahr vor | 7
Veröffentlicht
Narrow down your legends with IconColumnWidth
Guest Writer: Afiq Azaibi Afiq Azaibi is back to tell us about a new feature in R2024b that controls the width of a...
mehr als ein Jahr vor

Violin plot has tails that go beyond real data
The important concept to understand is that violin plots show a visual estimate of the data’s distribution beyond the observed v...
mehr als ein Jahr vor | 0
How to creat grouped violin plot?
MATLAB R2024b introduces a new violinplot with a grouping option. data = random(makedist('Weibull'),1000,8); xgroup = catego...
mehr als ein Jahr vor | 0