
Sie verfolgen jetzt diese Einreichung
- Aktualisierungen können Sie in Ihrem Feed verfolgter Inhalte sehen.
- Je nach Ihren Kommunikationseinstellungen können Sie auch E-Mails erhalten.
Zitieren als
Adam Aitkenhead (2026). Plot a 3D array using patch (https://de.mathworks.com/matlabcentral/fileexchange/28497-plot-a-3d-array-using-patch), MATLAB Central File Exchange. Abgerufen .
Quellenangaben
Inspiriert: Spectral Imaging Toolbox
Allgemeine Informationen
- Version (197 KB)
Kompatibilität der MATLAB-Version
- Kompatibel mit allen Versionen
Plattform-Kompatibilität
- Windows
- macOS
- Linux
| Version | Veröffentlicht | Versionshinweise | Action |
|---|---|---|---|
| 1.11.0 | The user can now define the lower and upper limits of the colorbar using the input parameter 'clim'. Also, the input flag 'sym' has been removed as this can be done using clim instead. |
||
| 1.9.0 | Provide the handle to the colorbar as an optional output. |
||
| 1.8.0 | Some minor code optimisations |
||
| 1.7.0 | Bugfix: Prevent a hole from appearing at the lowest values in a full colour plot. |
||
| 1.5.0 | The user can now specify the colour map for the display of a 3D numeric array. |
||
| 1.4.0 | Minor bugfix |
||
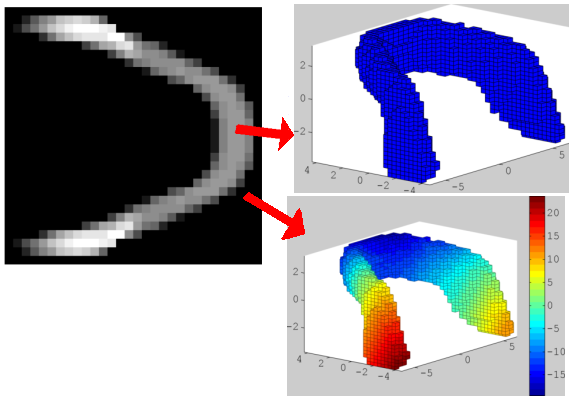
| 1.3.0 | Now enables a 3D numeric array to be plotted such that each facet corresponds to the value of each voxel in the array. |
||
| 1.2.0 | Added missing example.mat file |
||
| 1.1.0 | Improved documentation |
||
| 1.0.0 |

