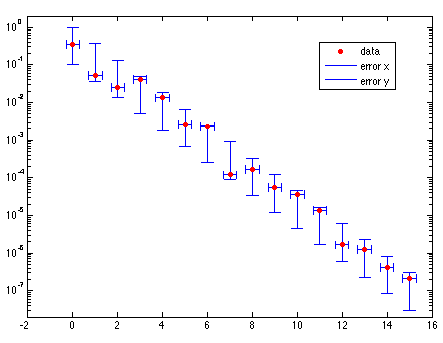
ploterr
plots data with x and/or y error bars and supports logarithmic scaling for both axes.

Sie verfolgen jetzt diese Einreichung
- Aktualisierungen können Sie in Ihrem Feed verfolgter Inhalte sehen.
- Je nach Ihren Kommunikationseinstellungen können Sie auch E-Mails erhalten.
Zitieren als
Felix Zoergiebel (2026). ploterr (https://de.mathworks.com/matlabcentral/fileexchange/22216-ploterr), MATLAB Central File Exchange. Abgerufen .
Allgemeine Informationen
- Version (5,83 KB)
Kompatibilität der MATLAB-Version
- Kompatibel mit allen Versionen
Plattform-Kompatibilität
- Windows
- macOS
- Linux
| Version | Veröffentlicht | Versionshinweise | Action |
|---|---|---|---|
| 1.3.0 | Added properties hhabsx, hhabsy and hhabsxy: Set the handle size to an absolute value rather than a fraction of the mean distance of the datapoints. |
||
| 1.2.0 | Bugfix. It is now possible to use no options. |
||
| 1.1.0 | Changed the user interface. Handle sizes and logarithmic scaling can now be set via properties. Passing LineSpec is not compulsory anymore when manually setting logscale or handle sizes. |
||
| 1.0.0 |

