
rebuild-MATLAB-contour


rebuild-MATLAB-contour
Rebuild a MATLAB contour plot coordinates by interpolating the available iso-lines data.
Detailed information
This MATLAB script reads a .dat file, which may be the output of the native MATLAB contour function. The input .dat file is loaded by a selection dialog box. The file content has to be a numerical array of (2 x n), that is 2 rows by n columns, containing the coordinates of the iso-lines. If the array is transposed (n x 2), this script will automatically transpose it to the correct form (2 x n).
Please, define your axes limits and labels before running this script.
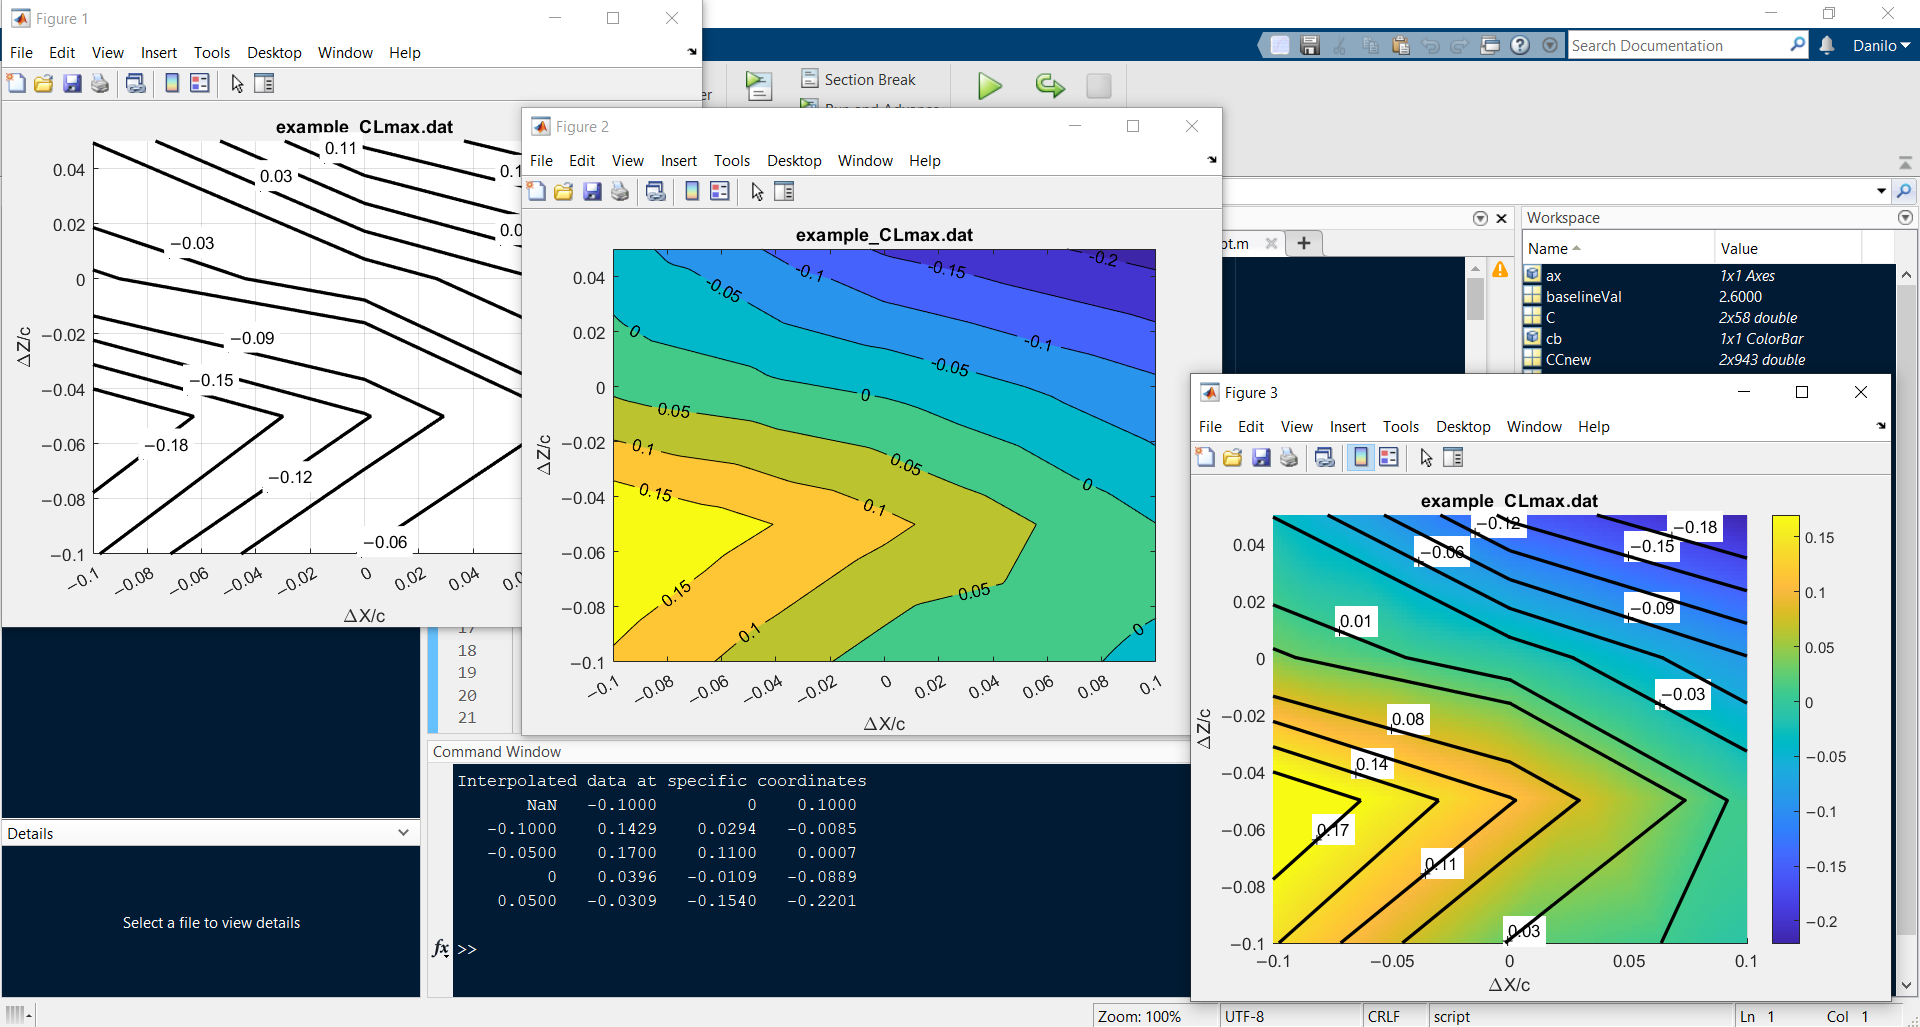
The script will attempt to rebuild the contour plot coordinates by interpolating between the available iso-lines. As output, it will provide a table (not a MATLAB Table, something more closer to what you may find in a spreadsheet table) with the interpolated X and Y coordinates as first column and first row respectively, and Z values. Also, it will replot the contour in three different modes:
- Figure 1: only black iso-lines
- Figure 2: the native MATLAB
contourffunction - Figure 3: a top-view of the native MATLAB
surffunction with smooth colors and overlapped black iso-lines
All the contours plot are labeled with the original values of the source iso-lines. However, during the execution the script will ask you for a new baseline value, if any. This is useful if you just want to translate your Z values, for instance if you need to edit the original contour chart and provide a new contour in terms of delta values instead of absolute values. The iso-lines distribution will not change, but the labels will be updated. You can ignore this feature (leaving the field empty will not generate an error and will assume your baseline is zero, i.e. no alteration of the Z values will be provided) or you may comment that part of the code, if it is annoying.
I've also added additional commands to rewrite negative numbers with the correct minus sign, instead of the default hyphen. This is very useful if you have to publish your charts and the editor asks you to replace hyphens with minus. This feature will save you a lot of time. Unfortunately I am not able to update the minus sign on the native contour plot labels, as numbers seem to be stored in a numeric array, not in a string, and being written on the plot at the generation of the contour (and there is no property available to edit them). Nonetheless, the hyphen-minus replacement works well in Figure 1 and Figure 3.
This script makes also use of the third part function C2xyz, which should be retrived from the official link.
Try it!
Do a test. Try it with the enclosed example example_CLmax.dat file (load it when required). Test it again by assigning a baseline value of 2.6, for instance.
Known issues
To get a high-quality figure, the plot renderer is forced to be painters, that is vectorial. However, in doing so, the labels in Figure 3 will be overlapped by the iso-lines, no matter when the renderer is called. To fix this, the statement
set(gcf,'Renderer','painters');`
should be commented, or the figure should be saved as .svg and manually edited later.
Zitieren als
engdancili (2024). rebuild-MATLAB-contour (https://github.com/dciliberti/rebuild-MATLAB-contour/releases/tag/v1.0.0), GitHub. Abgerufen .
Kompatibilität der MATLAB-Version
Plattform-Kompatibilität
Windows macOS LinuxTags
Quellenangaben
Inspiriert von: C2xyz contour matrix to coordinates
Community Treasure Hunt
Find the treasures in MATLAB Central and discover how the community can help you!
Start Hunting!Live Editor erkunden
Erstellen Sie Skripte mit Code, Ausgabe und formatiertem Text in einem einzigen ausführbaren Dokument.
| Version | Veröffentlicht | Versionshinweise | |
|---|---|---|---|
| 1.0.0 |
Sie können auch eine Website aus der folgenden Liste auswählen:
Amerika
- América Latina (Español)
- Canada (English)
- United States (English)
Europa
- Belgium (English)
- Denmark (English)
- Deutschland (Deutsch)
- España (Español)
- Finland (English)
- France (Français)
- Ireland (English)
- Italia (Italiano)
- Luxembourg (English)
- Netherlands (English)
- Norway (English)
- Österreich (Deutsch)
- Portugal (English)
- Sweden (English)
- Switzerland
- United Kingdom (English)
Asien-Pazifik
- Australia (English)
- India (English)
- New Zealand (English)
- 中国
- 日本Japanese (日本語)
- 한국Korean (한국어)