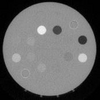
You can set xdata,ydata for imshow() as you do with image()/imagesc(), but by default imshow() will turn off axis visibility. You can turn it back on, but then you have to deal with the fact that the figure has been set up without consideration for the area required to show ticks and axis labels. You may have to adjust the position of the axes object to make room for everything.
I = imread('https://www.mathworks.com/matlabcentral/answers/uploaded_files/1028490/image.png');
xylim = [-90,90].*4.65./1000;
imshow(I,'Xdata',xylim,'Ydata',xylim);
set(gca,'visible','on')
colormap(hot);

The utility of imshow() is its conveniences for viewing pictures without extraneous axis decorations. If you're using it with the axis visible, I'm not sure why you wouldn't just use image()/imagesc() instead. You might need to set axis equal if you do, but that's about it.
https://www.mathworks.com/matlabcentral/answers/1288-what-is-the-difference-between-image-and-imshow
FWIW, the first answer is a bit misleading. Both image() and imshow() will display RGB images in truecolor and they'll both display grayscale images using a colormap. The only difference is that imshow() forces the use of a gray colormap instead of whatever map was being used in the axes at the time. Again, that's considered a matter of convenience. If you explicitly set the map after the the image is displayed, there really isn't any difference.