Simulate OLSR-based MANET for Emergency Response Scenario
R2026bEmergency response communication networks operate in infrastructure-less environments, such as disaster-affected areas where conventional communication systems are unavailable. In these scenarios, a command center maintains continuous communication with mobile response units for coordination.
Traditional reactive routing protocols like AODV discover routes on demand, which introduces an initial delay when nodes send messages. Optimized link state routing (OLSR) addresses this by proactively maintaining routes to all nodes. However, the proactive approach of OLSR adds continuous routing overhead. OLSR performs better than the reactive protocols in large and dense network scenarios with low to moderate mobility.
This example shows how to simulate such a network using a time division multiple access (TDMA)-based mobile ad hoc network (MANET) with OLSR. You configure the OLSR protocol parameters for different node roles, add application traffic and mobility, and analyze packet delivery ratio (PDR), routing overhead, and average end-to-end delay.
Emergency Response Scenario
In this example, you simulate an emergency response scenario with 10 nodes forming a multi-hop MANET that relies on the OLSR protocol to route messages.
Command center — A stationary node that sends and receives messages to and from all response units.
Response units — Mobile nodes that communicate with the command center and relay traffic when required.
Relay nodes — Stationary nodes placed between the command center and response units to enable multi-hop communication when direct links are not possible.
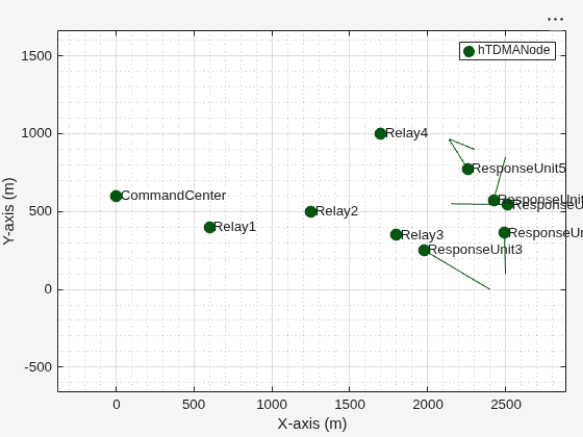
This figure shows the deployment of command center, response units, and relay nodes, where response units operate within the disaster zone. These response units move within a bounded area and communicate with the command center.
Initialize Network Simulator
Set the seed for the random number generator to 1 to ensure repeatability. The seed value controls the pattern of random number generation. The random number generated by the seed value impacts several processes within the simulation, including predicting packet reception success at the physical layer. To improve the accuracy of your simulation results after running the simulation, you can change the seed value, run the simulation again, and average the results over multiple simulations.
rng(1,"combRecursive")Specify simulation duration in seconds and initialize the wireless network simulator.
simulationTime =  100;
networkSimulator = wirelessNetworkSimulator.init;
100;
networkSimulator = wirelessNetworkSimulator.init;Configure Nodes and Transmission Slots
Create and configure a TDMA‑based MANET consisting of one command center, five response units, and four relay nodes using hTDMANode helper object by specifying their positions (in meters), transmission power (in dBm), and names. Set the positions and the transmission power of the nodes so that the response units and command center cannot communicate directly with each other.
commandCenter = hTDMANode(Position=[0 600 0],Name="CommandCenter",TransmitPower=10);

responseUnits = hTDMANode(Position=[2150 550 0; 2500 850 0; 2400 0 0; 2500 100 0; 2300 900 0], ...
    Name=["ResponseUnit1","ResponseUnit2","ResponseUnit3","ResponseUnit4","ResponseUnit5"], ...
    TransmitPower=10);

relayNodes = hTDMANode(Position=[600 400 0; 1250 500 0; 1800 350 0; 1700 1000 0], ...
    Name=["Relay1","Relay2","Relay3","Relay4"],TransmitPower=10);
nodes = [commandCenter responseUnits relayNodes];
Create the TDMA frame configuration using the hTDMAConfig helper object. Set the number of slots per frame to 20. The hTDMAConfig helper object also enables you to specify the slot duration and the guard duration. The default value of slot duration is 0.001 seconds and guard duration is 0 seconds.
tdmaConfig = hTDMAConfig(NumSlotsPerFrame=20);
Apply the TDMA frame configuration to all nodes using the configureTDMA function of the hTDMANode helper object.
configureTDMA(nodes,tdmaConfig)
Assign transmission slots based on the traffic load of each node. A transmission slot is a fixed time interval during which a node transmits data. TDMA divides time into repeating frames, each containing a fixed number of slots. The command center sends data to five response units. Assign 3 slots to handle this traffic. Each response unit exchanges data with the command center, so assign 1 slot per unit, which is sufficient for their lower traffic volume. The positions of relay nodes 1 and 2 are between the command center and the response units, so they carry most of the forwarded traffic. Assign 4 slots to each of these relay nodes. Relays 3 and 4 are closer to the response units and carry less forwarded traffic compared to other relay nodes. Assign 2 slots each.
slotBitMap = zeros(length(nodes),tdmaConfig.NumSlotsPerFrame);
slotBitMap(1,[1 11 20]) = 1;    % Command center gets slot 1, slot 11 and slot 20
slotBitMap(2,6) = 1;            % Response unit 1 gets slot 6
slotBitMap(3,7) = 1;            % Response unit 2 gets slot 7
slotBitMap(4,8) = 1;            % Response unit 3 gets slot 8
slotBitMap(5,9) = 1;            % Response unit 4 gets slot 9
slotBitMap(6,10) = 1;           % Response unit 5 gets slot 10
slotBitMap(7,[2 12 16 18]) = 1; % Relay 1 gets slot 2, slot 12, slot 16 and slot 18
slotBitMap(8,[3 13 17 19]) = 1; % Relay 2 gets slot 3, slot 13, slot 17 and slot 19
slotBitMap(9,[4 14]) = 1;       % Relay 3 gets slot 4 and slot 14
slotBitMap(10,[5 15]) = 1;      % Relay 4 gets slot 5 and slot 15
Assign transmission slots to all nodes using the assignSlot function of the hTDMANode helper object.
assignSlot(nodes,slotBitMap)
Configure OLSR
Add OLSR routing to all the nodes using the hOLSRRouting helper object. This helper object implements the OLSR protocol and provides properties to control routing behavior. The key OLSR properties include
Willingness— Preference of a node for forwarding traffic, specified as an integer in the range[0, 7]. The default value is3. Higher values make the node more likely to be selected as a relay in multi-point relay (MPR) selection.HelloInterval— Interval in seconds between HELLO messages for neighbor discovery, specified as a positive scalar. The default value is2. Lower values enable faster neighbor detection but increase routing overhead.TopologyControlInterval— Interval in seconds between topology control (TC) messages for route propagation, specified as a positive scalar. The default value is5. Lower values enable faster route convergence but increase routing overhead.
This example explains how to configure the forwarding behavior of each node using the Willingness property. Set the Willingness value according to the role of each node. Assign the highest willingness value to relay nodes to increase their chances of becoming forwarding nodes. Assign lower willingness values to response units so that they forward packets only when relay nodes are not directly reachable. Set the willingness value of the command center to zero so that it doesn't forward any packet.
Note that OLSR requires an initial convergence period to establish routes with other nodes in the network. During this phase, data packets drop if no route exists.
olsrRelay = hOLSRRouting(Willingness=7);         % Highest willingness
addMeshRouting(relayNodes,olsrRelay)

olsrResponseUnit = hOLSRRouting(Willingness=1);  % Lower willingness
addMeshRouting(responseUnits,olsrResponseUnit)

olsrCommandCenter = hOLSRRouting(Willingness=0); % No willingness
addMeshRouting(commandCenter,olsrCommandCenter)
Configure Traffic and Mobility
Generate an On-Off application traffic pattern by using the networkTrafficOnOff object. Configure the traffic by specifying the application data rate (in kbps), On time (in seconds), and Off time (in seconds). Add application traffic from the command center to all response units, and from each response unit to the command center. Assign higher data rate to the traffic from the command center to response units as the command center sends more information.
traffic = networkTrafficOnOff(DataRate=200,OnTime=1,OffTime=0);
addTrafficSource(commandCenter,traffic,DestinationNode=responseUnits) % Traffic from command center to all response units

traffic = networkTrafficOnOff(DataRate=100,OnTime=1,OffTime=0);
addTrafficSource(responseUnits,traffic,DestinationNode=commandCenter) % Traffic from response units to command center
Add mobility to all the response units using the addMobility function. Specify the mobility model as the random waypoint model. Set the speed range to [2, 5] meters per second within a 600 meter radius circle centered at [2400,500]. Update the node positions every 0.2 seconds.
addMobility(responseUnits,MobilityModel="random-waypoint", ...
    SpeedRange=[2 5],BoundaryShape="circle", ...
    Bounds=[2400 500 600],RefreshInterval=0.2)
Configure Visualization
To view the live network topology, set enableNetworkVisualization to true. To visualize state transition at the nodes as they transmit and receive packets, set enablePacketVisualization to true. To visualize the live queued packet count in the transmit buffer of nodes, set enableMetricVisualization to true.
enableNetworkVisualization =true; enablePacketVisualization =
false; enableMetricVisualization =
false;
Visualize the live network topology by using the wirelessNetworkViewer object.
if enableNetworkVisualization
    visualizerObj = wirelessNetworkViewer;
    addNodes(visualizerObj,nodes)
end
Visualize the state transition at the nodes by using the wirelessTrafficViewer object. To view the state transition at the nodes at the end of the simulation, set the RefreshRate property to 0. To visualize live state transitions during the simulation, set the RefreshRate property to a positive integer. Note that enabling live state transition with higher refresh rate proportionally increases the simulation runtime.
if enablePacketVisualization
    packetVisObj = wirelessTrafficViewer(ViewType="state-transition-plot",RefreshRate=0);
    addNodes(packetVisObj,nodes)
    hRegisterTDMAToTrafficViewer(packetVisObj,nodes)
end
Visualize the queued packet count in the transmit buffer of nodes by using the helperMetricsVisualizer helper function.
if enableMetricVisualization
    metricsVisObj = helperMetricsVisualizer(nodes,RefreshRate=1);
end
Run Simulation
Add nodes to the wireless network simulator.
addNodes(networkSimulator,nodes)
To calculate the application PDR, routing overhead, and average end-to-end delay of the network, use the helperTDMAKPIManager helper object with a LogInterval of 1 second.
performanceObj = helperTDMAKPIManager(nodes,["app-packet-delivery-ratio","app-average-end-to-end-delay","routing-overhead"],LogInterval=1);
Run the simulation for the specified simulation time.
run(networkSimulator,simulationTime)
Simulation Results
Calculate the overall PDR of the network. PDR is the ratio of application data packets successfully delivered at the destination nodes to the total number of application data packets transmitted by the source nodes.
pdr = kpi(performanceObj,[],[],"app-packet-delivery-ratio")pdr = 0.9106
The overall PDR of 91.06% shows that OLSR successfully maintains routes despite node mobility.
Calculate PDR for traffic in each direction between the command center and each response unit.
pdrCommandCenterToResponseUnits = kpi(performanceObj,commandCenter,responseUnits,"app-packet-delivery-ratio")pdrCommandCenterToResponseUnits = 1×5
0.8096 0.9184 0.9341 0.9916 0.9374
pdrResponseUnitsToCommandCenter = kpi(performanceObj,responseUnits,commandCenter,"app-packet-delivery-ratio")pdrResponseUnitsToCommandCenter = 1×5
0.7716 0.9073 0.9030 0.9541 0.9416
Response unit 1 shows lower PDR (77%) because it is the farthest from the relay nodes.
Calculate the routing overhead of the network. Routing overhead is the ratio of total number of routing packets to the total number of packets transmitted in the network.
routingOverheadVal = kpi(performanceObj,[],[],"routing-overhead")routingOverheadVal = 0.0147
The routing overhead of 1.47% highlights that the overhead introduced by the proactive OLSR protocol is significantly lower compared to the data traffic.
Calculate the average end‑to‑end delay for the entire network. Average end-to-end delay is the average time it takes for a data packet to travel from the source node to the destination node, in seconds.
avgEndToEndDelay = kpi(performanceObj,[],[],"app-average-end-to-end-delay")avgEndToEndDelay = 0.0374
Calculate the average-end-to-end-delay for traffic in each direction between the command center and each response unit.
avgDelayCommandCenterToResponseUnits = kpi(performanceObj,commandCenter,responseUnits,"app-average-end-to-end-delay")avgDelayCommandCenterToResponseUnits = 1×5
0.0202 0.0373 0.0337 0.0441 0.0508
avgDelayResponseUnitsToCommandCenter = kpi(performanceObj,responseUnits,commandCenter,"app-average-end-to-end-delay")avgDelayResponseUnitsToCommandCenter = 1×5
0.0330 0.0444 0.0219 0.0359 0.0468
The delay values reflect the combined impact of multi‑hop forwarding and TDMA scheduling on application traffic delivery.
In summary, this example simulates a TDMA‑based emergency response MANET that uses the OLSR protocol to support reliable multi‑hop communication between a command center, mobile response units, and relay nodes.
Further Exploration
Try running this example with a custom channel model. By default, this example uses a channel model that accounts for FSPL. You can replace this default channel model with a custom channel model to study its impact on PDR, routing overhead, and average end-to-end delay. For information about how to add a custom channel model, see Plug Custom Channel into Wireless Network Simulator.
Additionally, you can view the routes that OLSR establishes as text, using the helperDisplayRoutes function. Uncomment this code and add it after calling the run method of the simulator in the Run Simulation section.
% srcDstPairs = [commandCenter responseUnits(1);responseUnits(4) commandCenter];
% helperDisplayRoutes(srcDstPairs)
Supporting Functions
The example uses these helper functions and objects:
hTDMANode— Creates a TDMA nodehTDMAConfig— Creates a TDMA frame configuration objecthTDMANodeMesh— Implements mesh layer functionalityhTDMANodeMAC— Implements TDMA-based MAC functionalityhTDMANodePHY— Implements TDMA-based PHY functionalityhelperPacketDuplicateDetector— Detects duplicate packetshOLSRRouting— Implements the OLSR protocolhTDMANodeEventCallback— Invokes registered callbacks for the eventshelperTDMAKPIManager— Computes key performance indicators (KPI) of the TDMA networkhelperMetricsVisualizer— Plots MAC layer metrics
References
Clausen, Thomas H., and Philippe Jacquet. Optimized Link State Routing Protocol (OLSR). Request for Comments RFC 3626. Internet Engineering Task Force, 2003. https://datatracker.ietf.org/doc/rfc3626/.
See Also
Objects
wirelessNetworkSimulator|wirelessTrafficViewer|wirelessNetworkViewer|networkTrafficOnOff|nodeMobilityRandomWalk|nodeMobilityRandomWaypoint|nodeMobilityConstantVelocity

