Visualisieren von Wavelets, Wavelet-Paketen und Wavelet-Filtern
Dieses Beispiel zeigt, wie Sie mit wfilters, wavefun und wpfun Filter, Wavelet oder Wavelet-Pakete für eine bestimmte Wavelet-Familie abrufen können. Sie können teilbare 2D-Wavelets mit wavefun2 visualisieren.
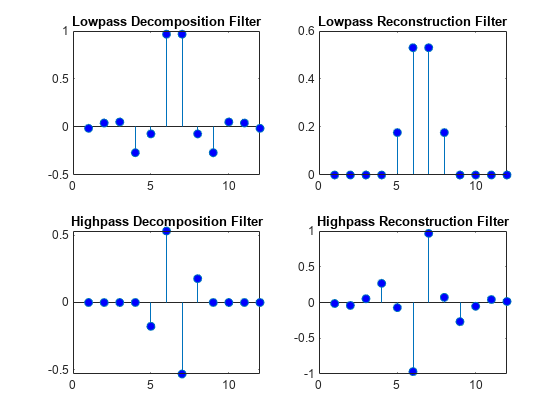
Ermitteln Sie die Zerlegungsfilter (Analyse) und Rekonstruktionsfilter (Synthese) für die biorthogonalen Spline-Wavelet-Filter mit 3 verschwindenden Momenten in den Rekonstruktionsfiltern und 5 verschwindenden Momenten in den Zerlegungsfiltern.
[LoD,HiD,LoR,HiR] = wfilters('bior3.5');
subplot(2,2,1)
stem(LoD,'markerfacecolor',[0 0 1]); title('Lowpass Decomposition Filter');
subplot(2,2,2)
stem(LoR,'markerfacecolor',[0 0 1]); title('Lowpass Reconstruction Filter');
subplot(2,2,3)
stem(HiD,'markerfacecolor',[0 0 1]); title('Highpass Decomposition Filter');
subplot(2,2,4)
stem(HiR,'markerfacecolor',[0 0 1]); title('Highpass Reconstruction Filter');
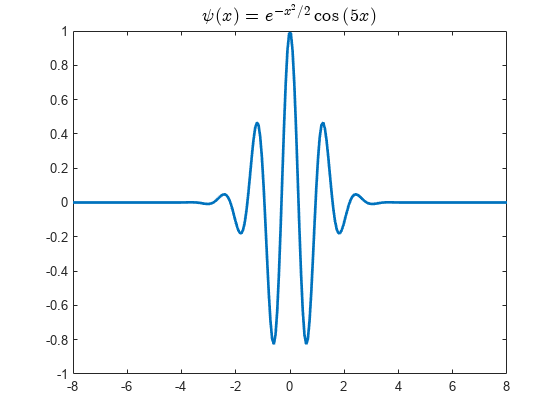
Visualisieren Sie das reellwertige Morlet-Wavelet. Es gibt keine zugehörige Skalierungsfunktion.
figure
[psi,xval] = wavefun('morl');
plot(xval,psi,'linewidth',2)
title('$\psi(x) = e^{-x^2/2} \cos{(5x)}$','Interpreter','latex',...
     'fontsize',14);
Rufen Sie die ersten 4 Wavelet-Pakete für das Least Assymetric Daubechies-Wavelet mit 4 verschwindenden Momenten, sym4, ab.
[wpws,x] = wpfun('sym4',4,10);
for nn = 1:size(wpws,1)
    subplot(3,2,nn)
    plot(x,wpws(nn,:))
    axis tight
    title(['W',num2str(nn-1)]);
end
