Count Objects Using CounTR Model
R2026bThis example demonstrates few-shot object counting using the Counting Transformer (CounTR) model, which counts objects in an image by identifying a few exemplars without additional training.
CounTR is a class-agnostic model that determines object counts by assessing the similarity between image patches and exemplars via an attention mechanism [1]. Unlike class-specific models that target specific categories like people or cars, class-agnostic counting relies on a few exemplar instances, known as few-shot counting. This model generates a density map by comparing image and exemplar features, and then derives the total object count from this map. The model counts objects that belong to the same category as the provided exemplars, even when individual instances in the image differ in shape, color, scale, or texture from those exemplars. The CounTR model used in this example was trained on the FSC-147 dataset, which includes 6,135 images from 147 diverse object categories, with counts ranging from 7 to 3,731 and an average of 56 objects per image [2]. The model effectively counts common objects in images without further training.
Download Deep NIR Fruit Detection Data Set
This example uses the Deep NIR Fruit Detection Data Set, which contains images of various types of fruit and berries captured using near-infrared (NIR) imaging technology [3]. These images are taken under different lighting and environmental conditions.
Specify dataDir as the location in which to store the data set. Download the data set and unzip the contents of the folder into the specified location using the downloadFruitDetectionData helper function. The function is attached to this example as a supporting file.
dataSetDownloadURL = "https://ssd.mathworks.com/supportfiles/vision/data/deepNIRFruitDetectionDataset.zip";
dataDir = fullfile(tempdir,"FruitDetectionDataset");
downloadFruitDetectionData(dataSetDownloadURL,dataDir);
Select Images Containing Blueberries
Create a pattern that matches any string containing the word "blueberry" with zero or more word characters before and after it while eliminating hidden files. Retrieve a list of all files and folders in the directory specified by dataDir and its subdirectories.
pattern = "^(?!\._).*blueberry.*";
fileList = dir(fullfile(dataDir,"**"));
Extract the folder paths and the file and folder names from fileList and store them in the folderNames and fileNames cell arrays, respectively. Then, check each file name and create an array of image files, whose file names contain "blueberry" and do not contain "json".
folderNames = {fileList.folder};
fileNames = {fileList.name};
matchedFiles = cellfun(@(x) ~isempty(regexpi(x,pattern,"once")) && isempty(regexpi(x, "json", "once")),fileNames);
Create full file paths for the files containing blueberries by concatenating folderNames and fileNames. Store the image file path results in filteredFileList.
filteredFileList = cellfun(@(x,y) string(x)+filesep+string(y),folderNames(matchedFiles),fileNames(matchedFiles));
fprintf("Found %d images containing blueberries.\n",numel(filteredFileList));
Found 23 images containing blueberries.
Select Exemplar Bounding Boxes
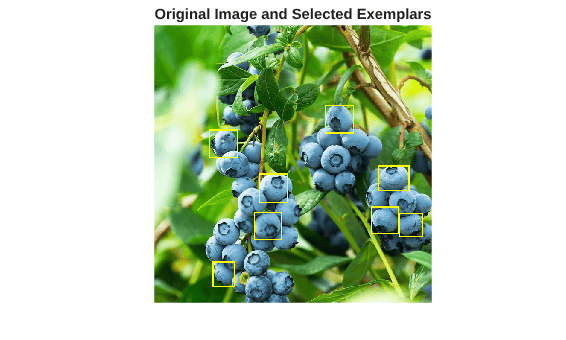
Select several exemplars, or bounding boxes that contain blueberries within the image. The CountTR model uses these exemplars to extract patches for computing similarity with the original image features. Typically, a minimum of three exemplars is necessary to achieve an accurate count. In this instance, select eight exemplars to count the blueberry instances across all filtered images.
Load Exemplar Image
Load an exemplar image from the filtered image files that contain blueberries.
exemplarImage = filteredFileList(1);
I = imread(exemplarImage);
Select Exemplars from Exemplar Image
Specify the rectangular bounding boxes for your exemplars. Alternatively, you can select bounding boxes interactively by using the selectBoundingBoxes helper function.
exemplarBboxes = ...
    [246.0000  349.0000   68.0000   67.0000
    402.0000  189.0000   66.0000   65.0000
    525.0000  330.0000   73.0000   58.0000
    235.0000  439.0000   65.0000   65.0000
    130.0000  246.0000   66.0000   65.0000
    510.0000  426.0000   63.0000   64.0000
    574.0000  442.0000   55.0000   55.0000
    138.0000  555.0000   52.0000   58.0000];
Overlay the selected exemplar bounding boxes on the image using the insertShape function. Then, display the annotated image.
annotatedImage = insertShape(I,"rectangle",exemplarBboxes,LineWidth=3);
imshow(annotatedImage)
title("Original Image and Selected Exemplars")
Configure CounTR Model
Configure a CounTR model using the exemplar image and bounding box exemplars, and extract image patches corresponding to the exemplar bounding box locations using the counTRObjectCounter object.
counTRObj = counTRObjectCounter(I,exemplarBboxes);
The CounTR model is a vision transformer-based model that processes images in 384-by-384 windows. During preprocessing, the model resizes the input image so that the height is 384 pixels and the width is scaled proportionally to maintain the original aspect ratio. To analyze the resized image, the model moves a 384-by-384 window along the width of the image, overlapping with the previous window position by 128 pixels. This overlap ensures continuity and helps detect features that span multiple windows. The model scales the exemplar bounding boxes using the scale factor of the resized image relative to the original image, and uses them to extract exemplar patches. The model then resizes the patches to 64-by-64 and uses them as the exemplar input for computing similarity.
Count Blueberries in Sample Image
Count the number of blueberries in a sample image using the countObjects object function.
count = countObjects(counTRObj,I);
fprintf("Number of objects detected: %d",count);
Number of objects detected: 47
Display Density Map
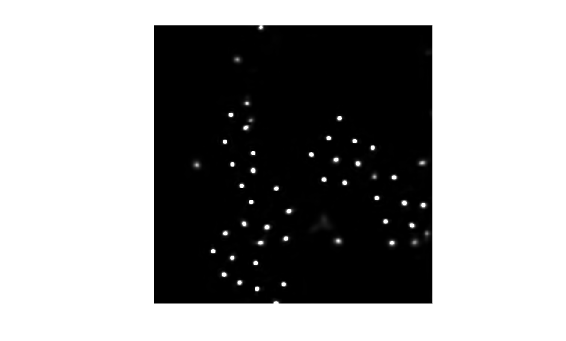
The CounTR model produces a density map at each pass of the sliding window over the image, where each pixel value indicates the estimated density of objects, such as blueberries, in that region of the image. The individual density maps from each sliding window position, or step, are combined or "blended" together to form a final density map for the entire image. The final density map provides a comprehensive view of object density and localization across the image. The model computes the object count by summing up the values in this accumulated density map.
Compute the density map of the image using the densityMap object function, and display it using the imshow function. The model localizes a number of blueberries at varying intensities.
densityMapOut = densityMap(counTRObj,I);
imshow(densityMapOut)
Overlay Density Map Over Image
Display the blended output by overlaying the density map onto the original image using the anomalyMapOverlay function. Include a text box in the overlay indicating the total count using the insertText function.
densityOverlayImage = anomalyMapOverlay(I,densityMapOut,Blend="equal");
fontSize = min(floor(size(densityOverlayImage,2)/30),200);
gutterWidth = fontSize*9;
densityOverlayImageWText = insertText(densityOverlayImage,[size(densityOverlayImage,2)-gutterWidth 5], ...
    sprintf("count=%d",count),FontSize=fontSize);
imshow(densityOverlayImageWText)
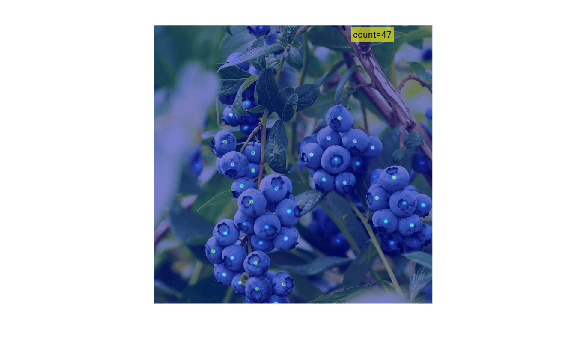
This visualization demonstrates the CounTR model's effectiveness in detecting the majority of blueberries, including those that are occluded or partially visible. Although the intensity for occluded and partial blueberries may be lower in the density map, they still contribute to the overall count.
Display a montage of the image, density map overlay, and density map.
montage({(I),densityOverlayImageWText,rescale(densityMapOut)},Size=[1 3],BorderSize=[0 10])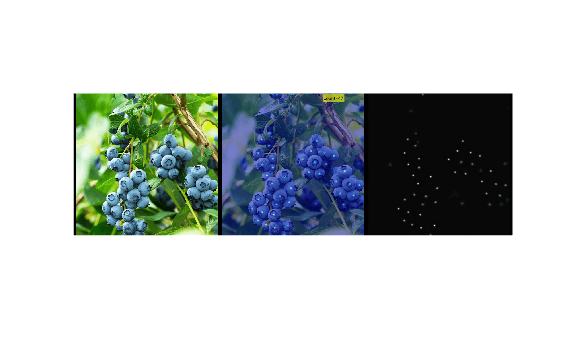
Compute Object Counts and Density Maps for Image Datastore
Create an image datastore containing all the images in the data set using the ImageDatastore object.
dsFilteredImages = imageDatastore(filteredFileList,FileExtensions=[".jpg",".png"]);
Count blueberries in all the images in the data set using the previously constructed CounTR object, counTRObj, as an input to the countObjects object function.
counts = countObjects(counTRObj,dsFilteredImages);
Running CounTR Object Counting network
--------------------------------------
* Processed 23 images.
Display Count Values
Display the blueberry count values computed from all the images as a stem plot.
stem(1:numel(dsFilteredImages.Files),counts)
grid on;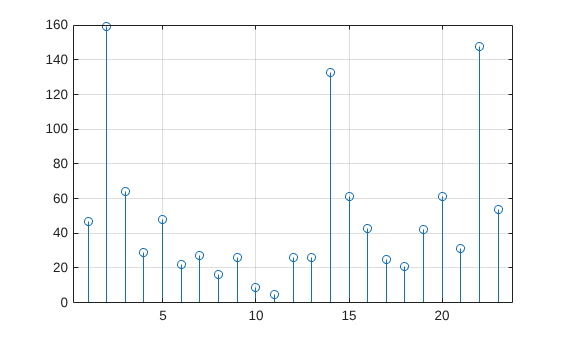
Compute Density Maps
Compute density maps for all images in the datastore using the densityMap object function. The densityMap object function computes density maps, writes them to disk as a .png files, and stores them in a dsDensityMaps datastore.
dsDensityMaps = densityMap(counTRObj,dsFilteredImages);
Running CounTR Object Counting network
--------------------------------------
* Processed 23 images.
Display Overlaid Density Map on All Images
Combine the image datastore, dsFilteredImages, and density map datastore, dsDensityMaps, to create a datastore of images with overlaid density maps, dsImageAndDensityMap. Using the slider, select the image index, imgIdx, of the image to display from the combined datastore. Display the density map and object count overlaid on the selected image using the overlayDensityMap helper function.
numDensityMaps = numpartitions(dsDensityMaps);
imgIdx = 7;
dsImageAndDensityMap = combine(dsFilteredImages,dsDensityMaps);
x = read(subset(dsImageAndDensityMap,imgIdx));
I = x{1};
densityMapOut = x{2};
count = counts(imgIdx);
densityOverlayImageWText = overlayDensityMap(I,densityMapOut,count);
imshow(densityOverlayImageWText)
7;
dsImageAndDensityMap = combine(dsFilteredImages,dsDensityMaps);
x = read(subset(dsImageAndDensityMap,imgIdx));
I = x{1};
densityMapOut = x{2};
count = counts(imgIdx);
densityOverlayImageWText = overlayDensityMap(I,densityMapOut,count);
imshow(densityOverlayImageWText)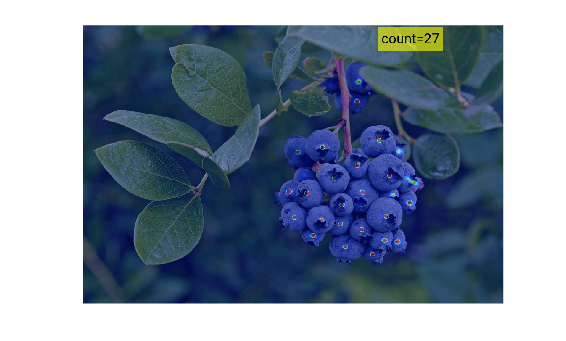
Helper functions
overlayDensityMap
function densityOverlayImageWText = overlayDensityMap(I,density_map,count)

densityOverlayImage = anomalyMapOverlay(I,density_map,Blend="equal");
fontSize = min(floor(size(densityOverlayImage,2)/30),200);
gutterWidth = fontSize*9;
densityOverlayImageWText = insertText(densityOverlayImage,[size(densityOverlayImage,2)-gutterWidth 5],...
    sprintf("count=%d",count),FontSize=fontSize);
end
selectBoundingBoxes
function boundingBoxes = selectBoundingBoxes(img) %#ok<DEFNU>
    % Display the image
    figure;
    imshow(img);
    title('Select bounding boxes, double-click on the box when done');
    hold on;

    % Initialize an array to store bounding box positions
    boundingBoxes = [];

    % Loop to allow multiple rectangle selections
    while true
        % Use drawrectangle to let the user draw a bounding box
        h = drawrectangle('Color', 'r');

        % Wait for the user to double-click or press Enter to finish drawing
        wait(h);

        % Get the position of the drawn rectangle
        position = h.Position;

        % Append the position to the boundingBoxes array
        boundingBoxes = [boundingBoxes; position]; %#ok<AGROW>

        % Ask the user if they want to select another bounding box
        choice = questdlg('Do you want to select another bounding box?', ...
            'Continue Selection', ...
            'Yes', 'No', 'Yes');

        % Break the loop if the user selects 'No'
        if strcmp(choice, 'No')
            break;
        end
    end

    % Close the figure
    close;

    % Display the selected bounding boxes
    disp('Selected bounding boxes:');
    disp(boundingBoxes);
end
References
[1] Liu, Chang, Yujie Zhong, Andrew Zisserman, and Weidi Xie. "Countr: Transformer-based generalised visual counting." arXiv preprint arXiv:2208.13721 (2022).
[2] Ranjan, Viresh, Udbhav Sharma, Thu Nguyen, and Minh Hoai. “Learning To Count Everything.” In 2021 IEEE/CVF Conference on Computer Vision and Pattern Recognition (CVPR), 3393–402. Nashville, TN, USA: IEEE, 2021. https://doi.org/10.1109/CVPR46437.2021.00340.
[3] Sa, Inkyu, Jong Yoon Lim, Ho Seok Ahn, and Bruce MacDonald. “deepNIR: Datasets for Generating Synthetic NIR Images and Improved Fruit Detection System Using Deep Learning Techniques.” Sensors 22, no. 13 (June 22, 2022): 4721. https://doi.org/10.3390/s22134721.
See Also
counTRObjectCounter | countObjects | densityMap | anomalyMapOverlay | insertShape

