vartestn
Multiple-sample tests for equal variances
Syntax
Description
vartestn( returns
a summary table of statistics and a box plot for a Bartlett test of
the null hypothesis that the columns of data vector x)x come
from normal distributions with the same variance. The alternative
hypothesis is that not all columns of data have the same variance.
vartestn( returns
a summary table of statistics and a box plot for a test of unequal
variances with additional options specified by one or more name-value
pair arguments. For example, you can specify a different type of hypothesis
test or change the display settings for the test results.x,Name,Value)
vartestn( returns
a summary table of statistics and a box plot for a test of unequal
variances with additional options specified by one or more name-value
pair arguments. For example, you can specify a different type of hypothesis
test or change the display settings for the test results.x,group,Name,Value)
Examples
Load the sample data.
load examgradesTest the null hypothesis that the variances are equal across the five columns of data in the students’ exam grades matrix, grades.
vartestn(grades)
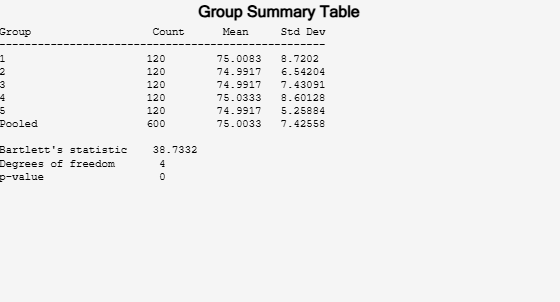

ans =
7.9086e-08
The low -value, p = 0, indicates that vartestn rejects the null hypothesis that the variances are equal across all five columns, in favor of the alternative hypothesis that at least one column has a different variance.
Load the sample data.
load carsmallTest the null hypothesis that the variances in miles per gallon (MPG) are equal across different model years.
vartestn(MPG,Model_Year)
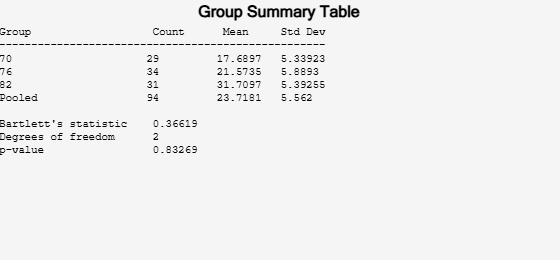
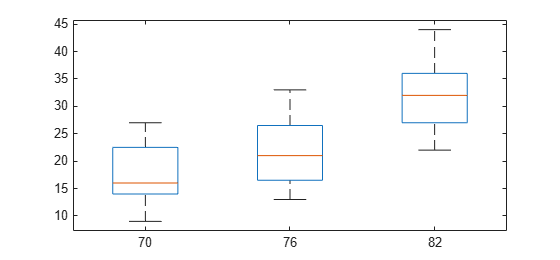
ans =
0.8327
The high -value, p = 0.83269, indicates that vartestn does not reject the null hypothesis that the variances in miles per gallon (MPG) are equal across different model years.
Load the sample data.
load carsmallUse Levene’s test to test the null hypothesis that the variances in miles per gallon (MPG) are equal across different model years.
p = vartestn(MPG,Model_Year,'TestType','LeveneAbsolute')
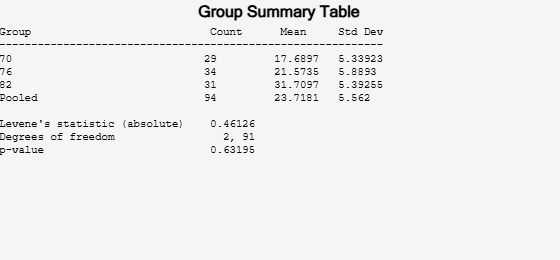

p =
0.6320
The high -value, p = 0.63195, indicates that vartestn does not reject the null hypothesis that the variances in miles per gallon (MPG) are equal across different model years.
Load the sample data.
load examgradesTest the null hypothesis that the variances are equal across the five columns of data in the students’ exam grades matrix, grades, using the Brown-Forsythe test. Suppress the display of the summary table of statistics and the box plot.
[p,stats] = vartestn(grades,'TestType','BrownForsythe','Display','off')
p =
1.3121e-06
stats = struct with fields:
    fstat: 8.4160
       df: [4 595]
The small -value, p = 1.3121e-06, indicates that vartestn rejects the null hypothesis that the variances are equal across all five columns, in favor of the alternative hypothesis that at least one column has a different variance.
Input Arguments
Name-Value Arguments
Output Arguments
More About
Version History
Introduced before R2006a