Cook’s Distance
Purpose
Cook’s distance is the scaled change in fitted values, which is useful for identifying outliers in the X values (observations for predictor variables). Cook’s distance shows the influence of each observation on the fitted response values. An observation with Cook’s distance larger than three times the mean Cook’s distance might be an outlier.
Definition
Each element in the Cook's distance D is the normalized change in the fitted response values due to the deletion of an observation. The Cook’s distance of observation i is
where
is the jth fitted response value.
is the jth fitted response value, where the fit does not include observation i.
MSE is the mean squared error.
p is the number of coefficients in the regression model.
Cook’s distance is algebraically equivalent to the following expression:
where ri is the ith residual, and hii is the ith leverage value.
How To
After fitting the model mdl, for example, you can use fitlm or stepwiselm to:
Display the Cook’s distance values by indexing into the property using dot notation.
mdl.Diagnostics.CooksDistance
CooksDistanceis an n-by-1 column vector in theDiagnosticstable of theLinearModelobject.Plot the Cook’s distance values.
For details, see theplotDiagnostics(mdl,'cookd')
plotDiagnosticsfunction of theLinearModelobject.
Determine Outliers Using Cook's Distance
This example shows how to use Cook's Distance to determine the outliers in the data.
Load the sample data and define the independent and response variables.
load hospital
X = double(hospital(:,2:5));
y = hospital.BloodPressure(:,1);
Fit the linear regression model.
mdl = fitlm(X,y);
Plot the Cook's distance values.
plotDiagnostics(mdl,'cookd')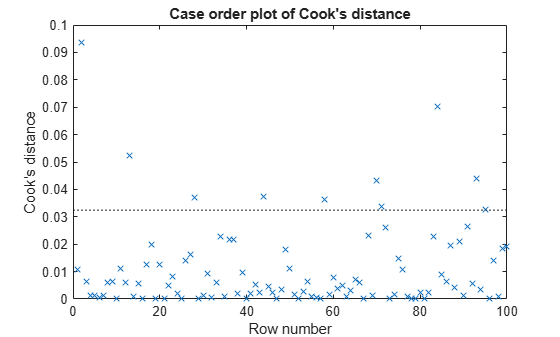
The dashed line in the figure corresponds to the recommended threshold value, 3*mean(mdl.Diagnostics.CooksDistance). The plot has some observations with Cook's distance values greater than the threshold value, which for this example is 3*(0.0108) = 0.0324. In particular, there are two Cook's distance values that are relatively higher than the others, which exceed the threshold value. You might want to find and omit these from your data and rebuild your model.
Find the observations with Cook's distance values that exceed the threshold value.
find((mdl.Diagnostics.CooksDistance)>3*mean(mdl.Diagnostics.CooksDistance))
ans = 10×1

     2
    13
    28
    44
    58
    70
    71
    84
    93
    95
Find the observations with Cook's distance values that are relatively larger than the other observations with Cook's distances exceeding the threshold value.
find((mdl.Diagnostics.CooksDistance)>5*mean(mdl.Diagnostics.CooksDistance))
ans = 2×1

     2
    84
References
[1] Neter, J., M. H. Kutner, C. J. Nachtsheim, and W. Wasserman. Applied Linear Statistical Models. 4th ed. Chicago: Irwin, 1996.
See Also
LinearModel | fitlm | stepwiselm | plotDiagnostics