Assign Enumerated Values in a Chart
To enhance the readability of a Stateflow® chart, use enumerated data. With enumerated data, you can:
Create a restricted set of values and refer to those values by name.
Group related values into separate data types.
Avoid defining a long list of constants.
Enumerated data is supported in Stateflow charts in Simulink® models. For more information, see Reference Values by Name by Using Enumerated Data.
Chart Behavior
This example shows how to build a chart that uses enumerated values to issue a status keyword.

During simulation, the chart action alternates between states A and
B.
Execution of State A
At the start of the simulation, state
Ais entered.State
Aexecutes theentryaction by assigning the valueREDto the enumerated datacolor.The data
yincrements once per time step (every 0.2 seconds) until the condition[y > 6]is true.The chart takes the transition from state
Ato stateB.
Execution of State B
After the transition from state
Aoccurs, stateBis entered.State
Bexecutes theentryaction by assigning the valueGREENto the enumerated datacolor.The data
ydecrements once per time step (every 0.2 seconds) until the condition[y < 3]is true.The chart takes the transition from state
Bback to stateA.
Build the Chart
Add States and Transitions to the Chart
Start MATLAB®. In the MATLAB Toolstrip, in the Home tab, click Simulink.
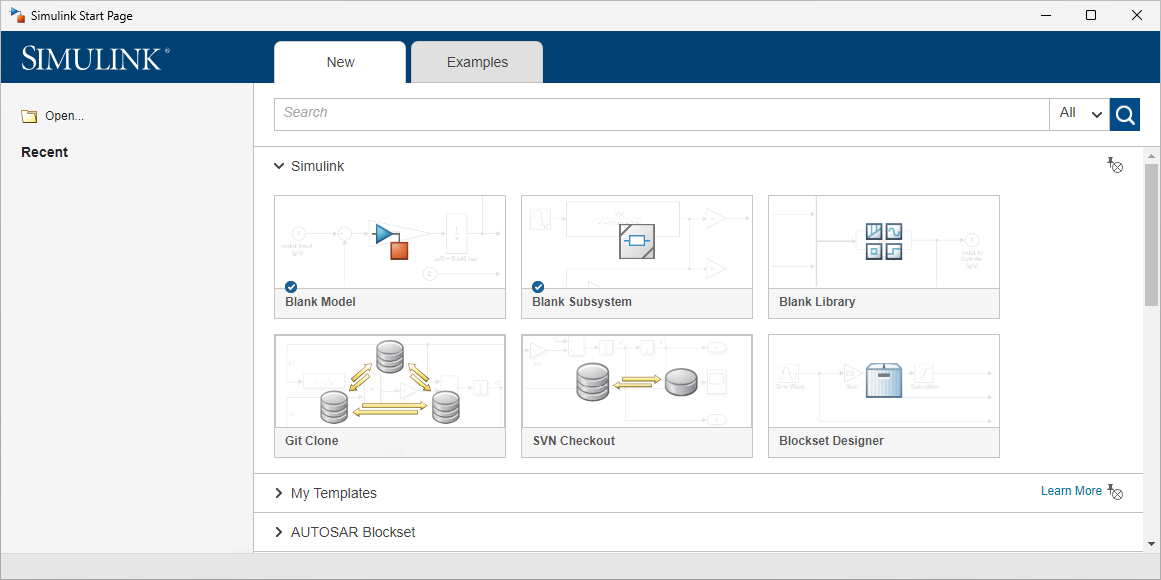
On the start page, in the Stateflow section, click the Blank Chart template. Open the Stateflow Editor by double-clicking the Chart block.
In the empty chart, add states
AandB. At the text prompt, enter the appropriate action statements.Add a default transition to state
Aand transitions between statesAandB.Double-click each transition. At the text prompt, enter the appropriate condition.
Define an Enumerated Data Type for the Chart
To create a file in which to store the data type definition, from the Home tab on the MATLAB toolstrip, select New > Class.
In the MATLAB Editor, enter:
Theclassdef TrafficColors < Simulink.IntEnumType enumeration RED(0) GREEN(10) end end
classdefsection defines an integer-based enumerated data type namedTrafficColors. Theenumerationsection contains the enumerated values that this data type allows followed by their underlying numeric value.Save your file as
TrafficColors.min a folder on the MATLAB search path.
Define Chart Data
To resolve the undefined data, in the Symbols pane, click the Resolve undefined symbols icon
 . The Stateflow Editor assigns an appropriate scope to each symbol in the
chart.
. The Stateflow Editor assigns an appropriate scope to each symbol in the
chart.Symbol Scope colorOutput Data yLocal Data GREENParameter Data REDParameter Data To specify
coloras enumerated data, in the Property Inspector:In the Type field, select
Enum: <class
                      name>
. Replace<class name>withTrafficColors, the name of the data type that you defined previously.Under Logging, select the Log signal data check box.
To set the scope and type of
y, in the Property Inspector:In the Scope field, select
Output.In the Type field, select
uint8.Under Logging, select the Log signal data check box.
In the Symbols pane, delete the symbols
GREENandRED. The Stateflow Editor incorrectly identified these symbols as parameters before you specifiedcoloras enumerated data.
View Logged Output
Simulate the model.
In the Simulation tab, under Review Results, select Data Inspector
 .
.In the Simulation Data Inspector (Simulink), in the Inspect pane, select the signals
colorandy. You can display the logged signals together or in separate axes. For more information, see Inspect Simulation Data (Simulink).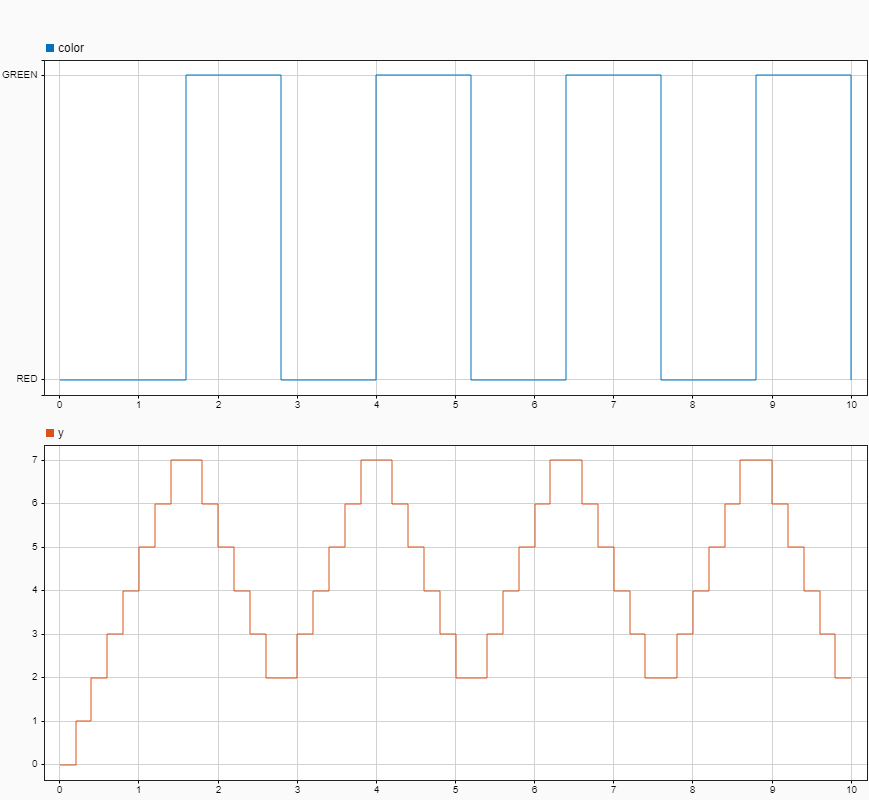
To access the logged data in the MATLAB workspace, call the signal logging object
logsout. For example, at the command prompt, enter:losgout = out.logsout; colorLog = logsout.getElement("color"); Tbl = table(colorLog.Values.Time,colorLog.Values.Data); Tbl.Properties.VariableNames = ["SimulationTime","Color"]
Tbl =

  9×2 table

    SimulationTime    Color
    ______________    _____

           0          RED
         1.6          GREEN
         2.8          RED
           4          GREEN
         5.2          RED
         6.4          GREEN
         7.6          RED
         8.8          GREEN
          10          RED
See Also
Simulation Data Inspector (Simulink)