Types of Coverage for Stateflow Charts
Cyclomatic Complexity for Stateflow Charts
Cyclomatic complexity is a measure of the complexity of a software module based on its edges, nodes, and components within a control-flow chart. It provides an indication of how many times you need to test the module.
The calculation of cyclomatic complexity is as follows:
CC = E - N + p
where CC is the cyclomatic complexity, E is
the number of edges, N is the number of nodes, and
p is the number of components.
Within the Model Coverage tool, each decision is exactly equivalent to a single control flow node, and each decision outcome is equivalent to a control flow edge. Any additional structure in the control-flow chart is ignored since it contributes the same number of nodes as edges and therefore has no effect on the complexity calculation. Therefore, you can express cyclomatic complexity as follows:
CC = OUTCOMES - DECISIONS + p
For analysis purposes, each chart counts as a single component.
Decision Coverage for Stateflow Charts
Decision coverage interprets a model execution in terms of underlying decisions where behavior or execution must take one outcome from a set of mutually exclusive outcomes.
Note
Full coverage for an object of decision means that every decision has had at least one occurrence of each of its possible outcomes.
Decisions belong to an object making the decision based on its contents or properties. The following table lists the decisions recorded for model coverage for the Stateflow® objects owning them. The sections that follow the table describe these decisions and their possible outcomes.
Object | Possible Decisions |
|---|---|
Chart | If a chart is a triggered Simulink® block, it must decide whether or not to execute its block. If a chart contains exclusive (OR) substates, it must decide which of its states to execute. |
State | If a state is a superstate containing exclusive (OR) substates, it must decide which substate to execute. If a state has |
Transition | If a transition is a conditional transition, it must decide whether or not to exit its active source state or junction and enter another state or junction. If a transition exiting a junction is conditional, model coverage may differ from software-in-the-loop mode code coverage. For more information, see Troubleshoot Model Coverage for Conditional Transitions in Stateflow Charts. |
Chart as a Triggered Simulink Block Decision
If the chart is a triggered block in a Simulink model, the decision to execute the block is tested. If the block
is not triggered, there is no decision to
execute the block, and the measurement of decision coverage is not applicable
(NA).
Chart Containing Exclusive OR Substates Decision
If the chart contains exclusive (OR) substates, the decision on which substate
to execute is tested. If the chart contains only parallel AND substates, this
coverage measurement is not applicable (NA).
Superstate Containing Exclusive OR Substates Decision
Since a chart is hierarchically processed from the top down, procedures such as exclusive (OR) substate entry, exit, and execution are sometimes decided by the parenting superstate.
Note
Decision coverage for superstates applies only to exclusive (OR) substates. A superstate makes no decisions for parallel (AND) substates.
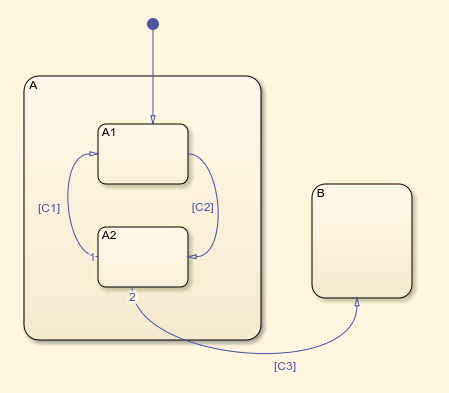
Since a superstate must decide which exclusive (OR) substate to process, the number of decision outcomes for the superstate is the number of exclusive (OR) substates that it contains. In the examples that follow, the choice of which substate to process can occur in one of three possible contexts.
Note
Implicit transitions appear as dashed lines in the following examples.
| Context | Example | Decisions That Occur |
|---|---|---|
Active call | States
|
During processing of state |
Implicit substate exit | A transition takes place whose source is superstate A and whose destination is state B.
| If the superstate has two exclusive (OR) substates, it is the decision of superstate A which substate performs the implicit transition from substate to superstate. |
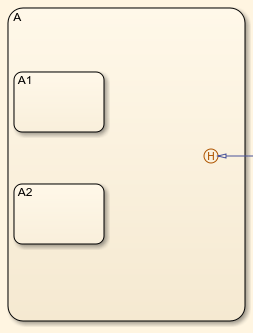
Substate entry with a history junction | A history junction records which substate was last active before the superstate was exited.
| If that superstate becomes the destination of one or more transitions, the history junction decides which previously active substate to enter. |

For more information, see State Details Report Section.
State with On Event_Name Action Statement Decision
A state that has an on
event_name action statement must decide
whether to execute that statement based on the reception of a specified event or
on an accumulation of the specified event when using temporal logic
operators.
Conditional Transition Decision
A conditional transition is a transition with a triggering event and/or a guarding condition. In a conditional transition from one state to another, the decision to exit one state and enter another is credited to the transition itself.
Note
Only conditional transitions receive decision coverage. Transitions without decisions are not applicable to decision coverage.
Condition Coverage for Stateflow Charts
Condition coverage reports on the extent to which all possible outcomes are achieved for individual subconditions composing a transition decision or for logical expressions in assignment statements in states and transitions.
For example, for the decision [A & B & C] on a transition, condition coverage reports on the true and false occurrences of each of the subconditions A, B, and C. This results in eight possible outcomes: true and false for each of three subconditions.
| Outcome | A | B | C |
|---|---|---|---|
| 1 | T | T | T |
| 2 | T | T | F |
| 3 | T | F | T |
| 4 | T | F | F |
| 5 | F | T | T |
| 6 | F | T | F |
| 7 | F | F | T |
| 8 | F | F | F |
For more information, see Transition Details Report Section.
MCDC Coverage for Stateflow Charts
The Modified Condition Decision/Coverage (MCDC) option reports a test's coverage of occurrences in which changing an individual subcondition within a logical expression results in changing the entire expression from true to false or false to true.
For example, if a transition executes on the condition [C1 & C2 &
C3 | C4 & C5], the MCDC report for that transition shows actual
occurrences for each of the five subconditions (C1, C2, C3, C4,
C5) in which changing its result from true to false is able to change
the result of the entire condition from true to false.
Relational Boundary Coverage for Stateflow Charts
If a transition in a Stateflow chart involves a relational operation, it receives relational boundary coverage. For more information, see Relational Boundary Coverage.
Simulink Design Verifier Coverage for Stateflow Charts
You can use the following Simulink Design Verifier™ functions inside Stateflow charts:
sldv.condition(Simulink Design Verifier)sldv.test(Simulink Design Verifier)sldv.assume(Simulink Design Verifier)sldv.prove(Simulink Design Verifier)
If you do not have a Simulink Design Verifier license, you can collect model coverage for a Stateflow chart containing these functions, but you cannot analyze the model using the Simulink Design Verifier software.
When you specify the Objectives and Constraints coverage metric in the Coverage pane of the Configuration Parameters dialog box, the Simulink Coverage™ software records coverage for these functions.
Each of these functions evaluates an expression expr,
for example, sldv.test(, where
expr)expr is any
valid Boolean MATLAB® expression. Simulink
Design Verifier coverage measures the number of time steps that the expression
expr evaluates to true.
If expr is true for at least one
time step, Simulink
Design Verifier coverage for that function is 100%. Otherwise, the Simulink
Coverage software reports coverage for that function as 0%.
Consider a model that contains this Stateflow chart:
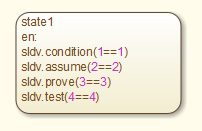
To collect coverage for Simulink Design Verifier functions, on the Coverage pane in the Configuration Parameters dialog box, select Objectives and Constraints.
After simulation, the model coverage report lists coverage for the
sldv.condition, sldv.assume,
sldv.prove, and sldv.test functions.