Analyze Model Coverage by Using the Test Manager in Simulink Test
If you have a Simulink® Test™ license, you can collect coverage directly from the Test Manager. For more information about Simulink Test, see Get Started with Simulink Test (Simulink Test).
When you analyze coverage for a model, Simulink Coverage™ reports on and highlights the model objects in your design that were exercised during simulation. Use the Test Manager to explore tests and aggregated coverage to see which tests exercise certain model objects. You can run multiple tests in a test suite, analyze coverage for each test, then view the aggregated results for the result set in the Test Manager. Use the coverage reports and model highlighting to learn which parts of your model activated during the specified test cases.
Open the Model
Open the slvnvdemo_powerwindow model. The slvnvdemo_powerwindow model contains a power window controller and a low-order plant model. The controller is implemented with a Stateflow® chart.
Choose Your Coverage Metrics
On the Apps tab, click Simulink Test to open the Tests tab. Click Simulink Test Manager.
This example includes a test file. In the Test Manager, click
Open. In the Open File window, select
powerwindow_tests.mldatx.
In the Test Browser pane, click
powerwindow_tests. Then expand the coverage options by
clicking Coverage Settings.

To enable coverage for the model, under Coverage to Collect, select Record coverage for system under test. Under Coverage Metrics, you can select the metrics you want to report. For information about the coverage metrics, see Structural Coverage Metrics.
For this example, select Decision, Condition, and MCDC.
Run A Test and Collect Coverage
There are two tests in the powerwindow_tests test file.
Test Case 1 has the Signal Editor scenario
set to Driver, and is the default setting in the model.
Test Case 2 has the Signal Editor scenario
set to Passenger.
In the Test Manager, you can run individual tests or entire test suites by selecting them in the Test Browser and clicking Run. Select Test Case 1 and click Run.
When the test finishes, the Results and Artifacts tab opens. Click the results for the test to see a summary of the coverage results.

Test Case 1 is the case where the Signal Editor scenario is set to
Driver. You can click the name of the model in the
Analyzed Model column of the Coverage
Results table to display the coverage results in the model with model
highlighting enabled. The Coverage Details pane also opens in
the Simulink window.
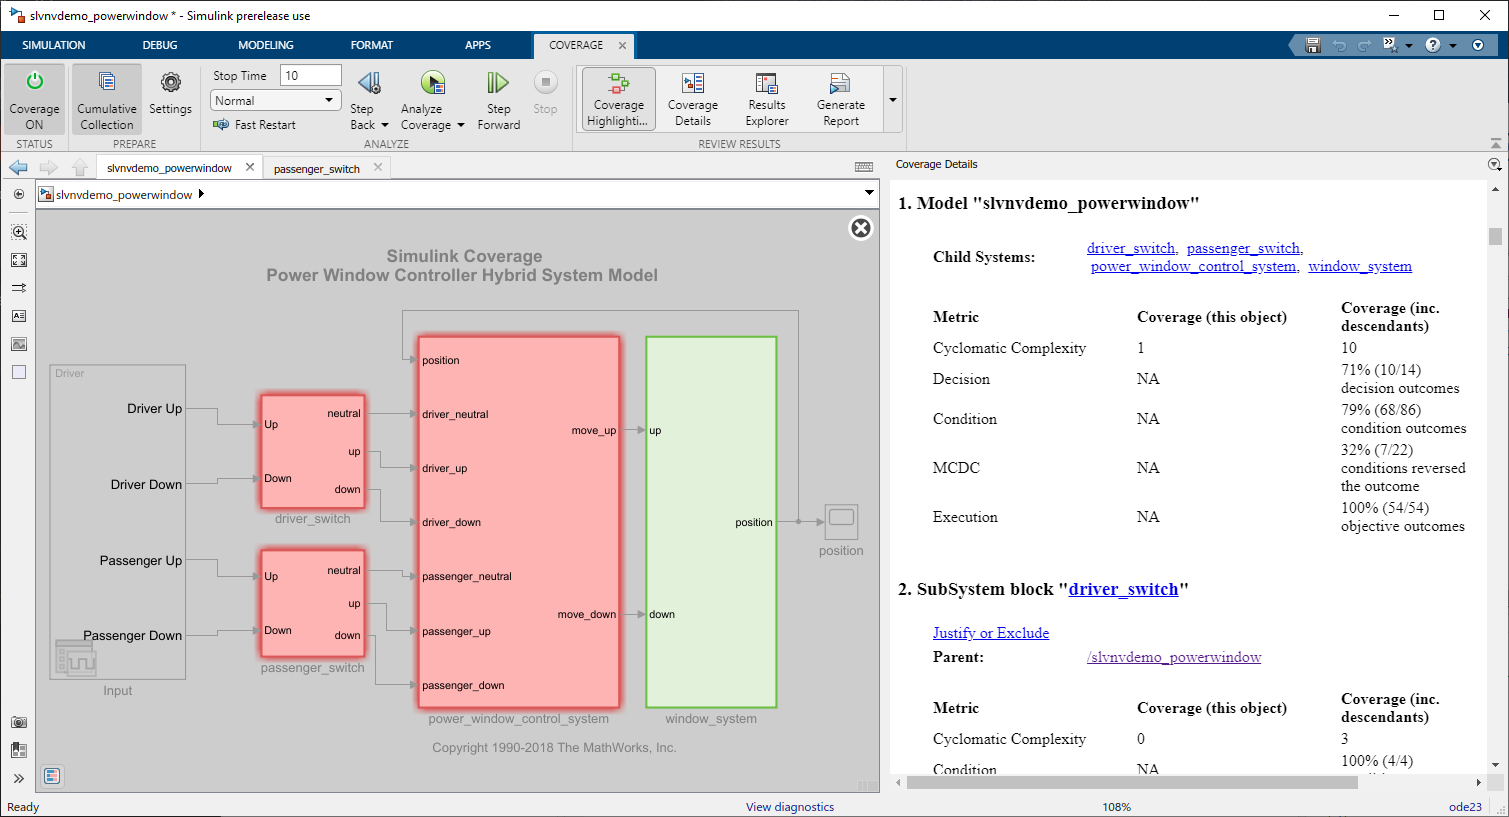
The window_system subsystem is green because every block inside
the subsystem received 100% coverage. The other subsystems are red because one or
more blocks inside did not receive full coverage.
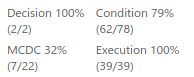
You can point to a subsystem to see a short summary of coverage for each relevant
metric. For example, point to the power_window_control_system
subsystem block.
If you left click on a block, the Coverage Details pane
displays the section of the report for that block. For example, click on the
power_window_control_system subsystem.

You can enter a subsystem to view the granular coverage results for the contents
of that subsystem. Double-click the power_window_control_system
subsystem and view the coverage results for the blocks it contains. Double-click on
validate_passenger, then check_up.
Click the And block allow_action to display the
relevant section of the report.
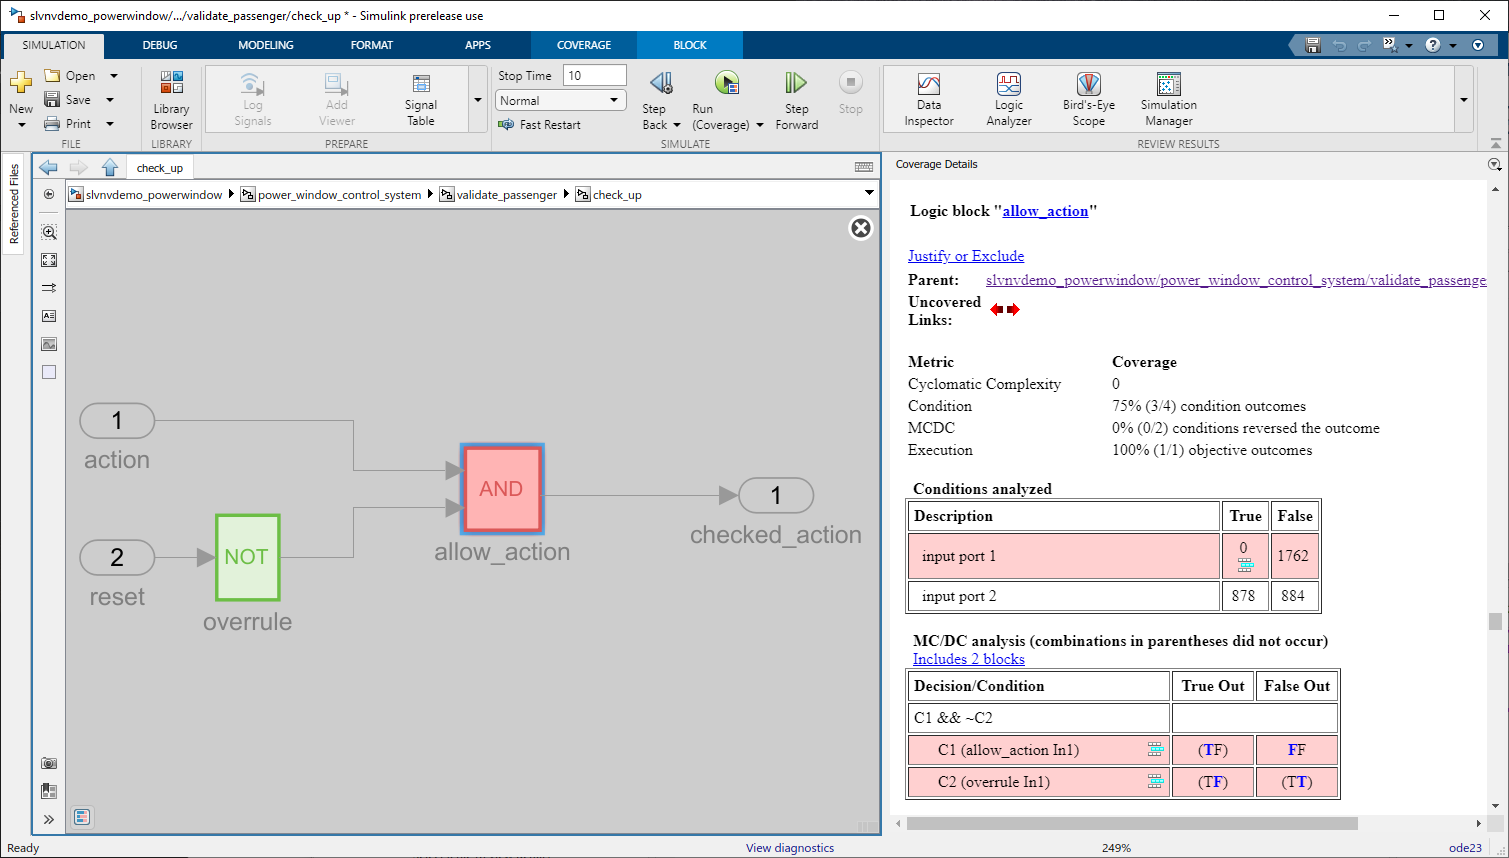
Click the And block to see the condition and MCDC results. Because
the And block outputs the logical combination of the two input
signals, if both input signals are true, the output signal is true. You can see from
the condition table that input signal 1 was false at every time
step, while input signal 2 was true for 878 time steps and
false for 884 time steps. Because there are four condition
outcomes and one of them did not occur, the allow_action block
received 75% condition coverage.
The MCDC analysis table lists decision reversals that occur because one condition
outcome changes from true to false or from
false to true. This table reports that
only the FF case occurred for the first condition, and neither
MCDC objective occurred for the second condition, which results in 0% MCDC
reported.
Run Multiple Tests and View Aggregated Coverage
In the slvnvdemo_powerwindow model, the And
block
power_window_control_system/validate_passenger/check_up/allow_action
has 75% condition coverage because the Signal Editor block
Input at the model root level has the Active
scenario set to Driver. This missing
coverage can be resolved by including Test Case 2 in the
coverage analysis.
In the Test Manager, open the Test Browser tab. Click Powerwindow Test Suite, then click Run to run the tests in the test suite. When the tests finish, the Test Manager opens the Results and Artifacts pane. Expand results for the new test. You can view the coverage results for each individual test by expanding each test case.
Select Powerwindow Test Suite, then click the model name,
slvnvdemo_powerwindow, to open the model with coverage
highlighting. Navigate to
power_window_control_system/validate_passenger/check_up and
click the And block. In the coverage report, the condition coverage
is now 100%. Additionally, the T1 and T2
link in the condition and MCDC tables link to the test that satisfies each
objective. For example, the true case of the first condition was
satisfied by test case 2, T2. Click the link to scroll to the
Aggregated Tests section of the report.
In the Test Manager, in the Aggregated Coverage Results table, the overall coverage results improved. When you click on the test suite or the test file name, you see the aggregated coverage results for the tests inside.

The aggregated results show higher coverage percentages than either of the two individual test cases because the test cases satisfy different objectives in some blocks.
Filter Coverage Outcomes
If you analyze the coverage report and find that you are missing coverage that is not possible to fix by changing the model or a test case, you can filter the missing outcomes so that they are not reported as missing coverage. Although you cannot filter coverage directly from the Test Manager, you can apply an existing filter and view the changes in your coverage results. Some possible reasons you might want to filter coverage outcomes include:
A block is tested by a different test suite, and is not applicable to the current coverage analysis.
A block is intended to catch edge cases that you think should not occur anyway. This type of model design is sometimes called defensive coding.
There are two types of coverage filters:
An exclusion filter rule can be applied to a model element, and causes that element to be ignored by coverage analysis. The excluded model elements appear dimmed in the highlighted model, like other elements that are not applicable to the metrics you selected.
A justification filter rule can be applied to a coverage outcome that is not satisfied. This filter rule allows Simulink Coverage to analyze the rest of the model element but does not report the justified outcome as missing coverage. This filter rule allows you to improve your coverage for a model object without excluding it entirely.
Suppose that the And block condition 1 MCDC outcome has been tested by a different test suite and is not applicable for this case. You can justify the outcome so that it is not reported as missing coverage.
In the model, navigate to the subsystem
power_window_control_system/validate_passenger/check_up and
click the And block allow_action to scroll to the
relevant section in the coverage report. The MCDC condition C1
(allow_action In1) is incomplete because the TF
case did not occur. To justify the C1 (allow_action In1) MCDC
outcome, click the Add justification rule icon ![]() .
.
The Coverage Results Explorer opens the Filter Editor pane with a new untitled filter file. The filter file contains a justification rule for the specified outcome. You can add multiple filter rules to the same filter file.
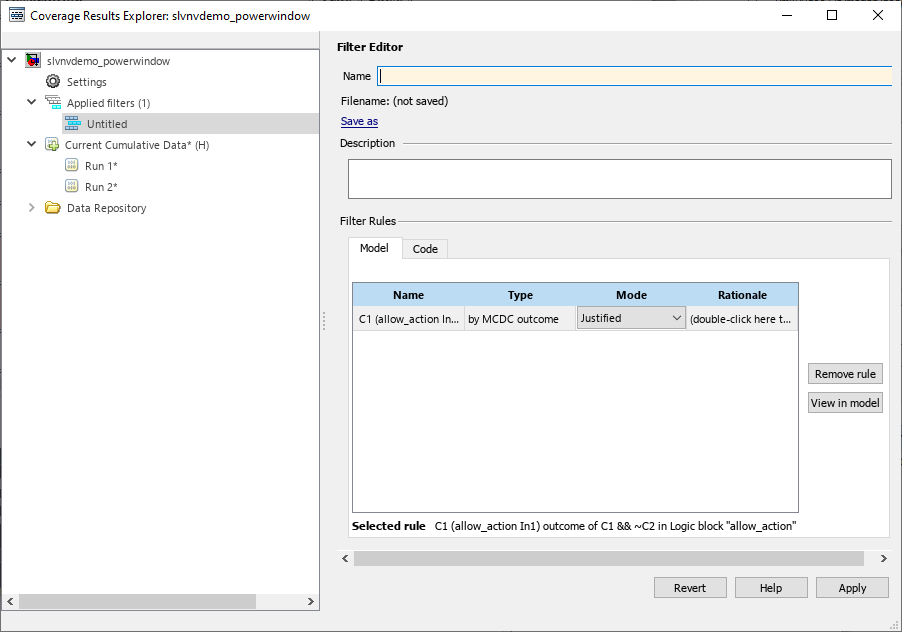
In the Name field, enter
slvnvdemo_powerwindow_filter. Under Filter
Rules, double-click the Rationale field and
enter Tested in a different test suite. Click
Apply, then save the file. The model and coverage report
automatically update to indicate that the outcome is justified.
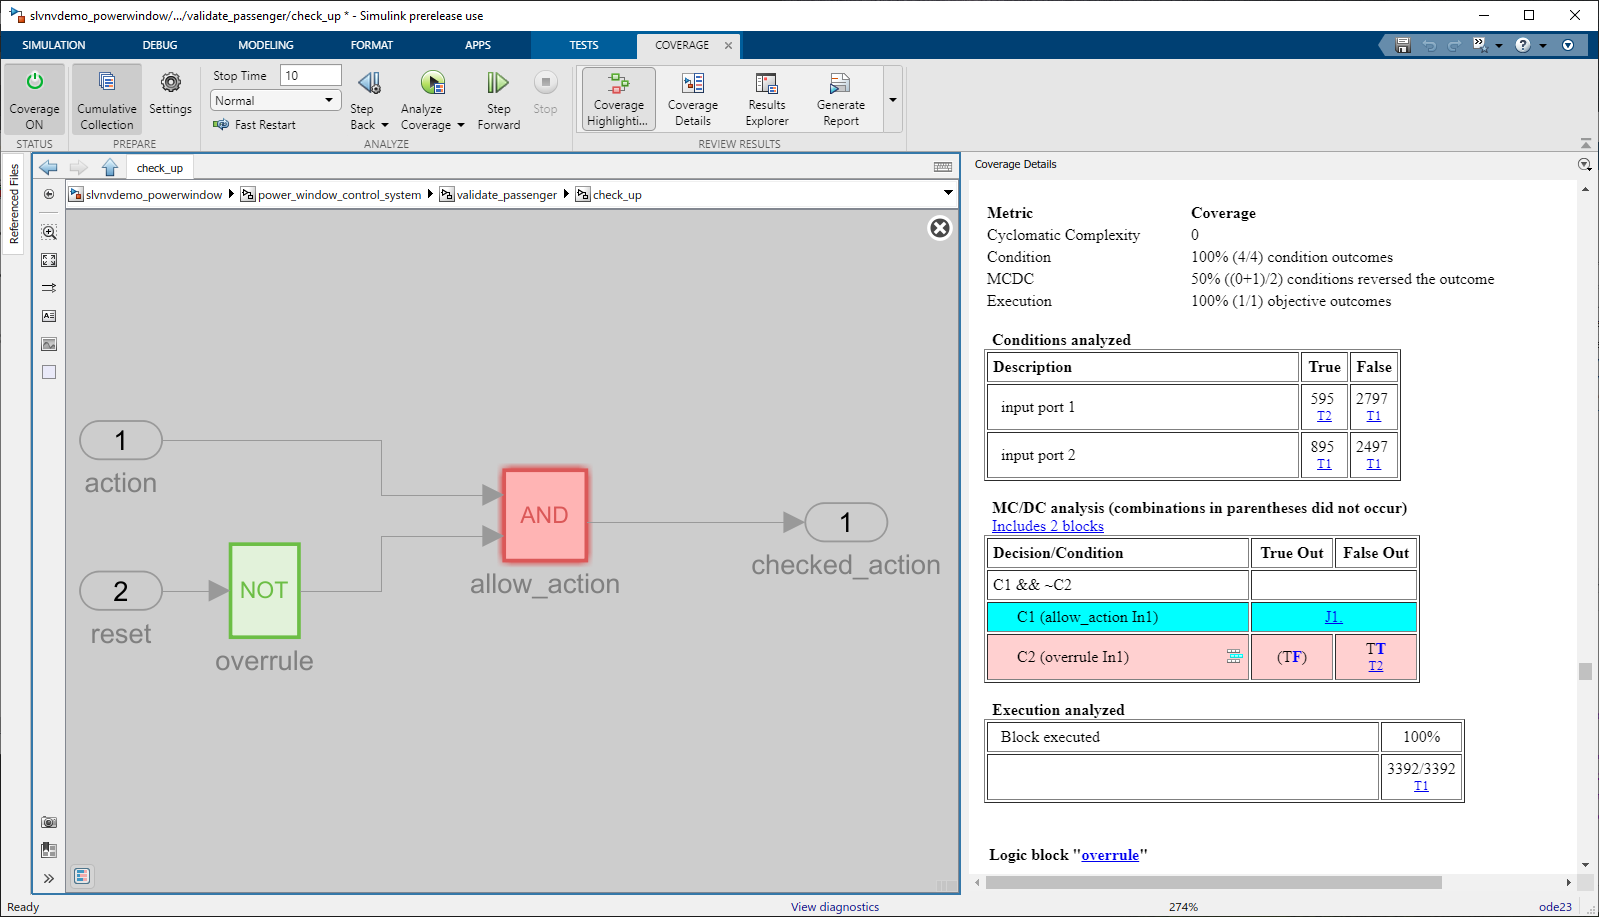
In the Coverage Details pane, the justified outcome is highlighted in cyan and links to the justification rationale. Clicking J1 brings you to the section of the report titled Objects Filtered from Coverage Analysis. This section of the report only appears if you apply one or more filters to the coverage data.
Go back to the Test Manager. Click the result set. In the Aggregated Coverage Results section, the coverage filter has been applied automatically, and the MCDC coverage result is now 50%.
Note
You must click on a the top-level results to see the applied coverage filters. The filter is not included in test suite or test case results.
To apply another coverage filter file, click the results set, expand the Coverage Filters section, and then click Add.
Create and Archive Reports
To create a coverage report, click the arrow in the Report
column. Alternatively, you can click Export under the
Aggregated Coverage Results table. Then use cvhtml to create a coverage
report. For example, export the results with the variable name
coverageData and then
enter:
cvhtml('testManager_covData',coverageData)