sbioncaoptions
Specify options to calculate noncompartmental analysis (NCA) parameters
Syntax
Description
Examples
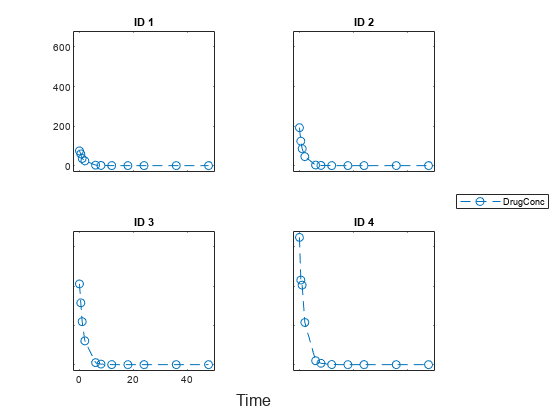
Load a synthetic data set that contains the drug concentration measurements of four individuals after an IV bolus dose.
load data1.matSet the dose amounts to NaN at time points when no dose was administered.
data1.Dose(data1.Dose(:) == 0) = NaN;
Display the data.
sbiotrellis(data1,'ID','Time','DrugConc','Marker','o','LineStyle','--');

Categorize the data columns using an NCA options object.
opt = sbioncaoptions; opt.groupColumnName = 'ID'; opt.concentrationColumnName = 'DrugConc'; opt.timeColumnName = 'Time'; opt.IVDoseColumnName = 'Dose';
Compute NCA parameters for each individual.
ncaparameters = sbionca(data1,opt);
Display the first few columns of the table. Each row of ncaparameters table represents an individual (or group), and each column lists the corresponding NCA parameter value.
ncaparameters(:,1:15)
ans=4×15 table
    ID    doseSchedule    administrationRoute    Lambda_Z      R2       adjusted_R2    Num_points    AUC_0_last    Tlast    C_max     C_max_Dose    T_max     MRT      T_half    AUC_infinity
    __    ____________    ___________________    ________    _______    ___________    __________    __________    _____    ______    __________    _____    ______    ______    ____________
    1      {'Single'}         {'IVBolus'}        0.57893     0.99991       0.9999          11          143.61       48      74.412      1.4882        0      1.5408    1.1973       143.61   
    2      {'Single'}         {'IVBolus'}        0.66798     0.99998      0.99998          11          299.37       48      191.96      1.9196        0      1.3352    1.0377       299.37   
    3      {'Single'}         {'IVBolus'}        0.62124     0.99999      0.99999          11           766.5       48      411.06      1.6442        0      1.4476    1.1157        766.5   
    4      {'Single'}         {'IVBolus'}        0.58011     0.99995      0.99995          11          1301.8       48      648.33      1.2967        0      1.5721    1.1949       1301.8   
You can also specify a custom time range to compute T_max and C_max within that time range, say from time = 0 to 20. You can do so by setting the C_max_ranges property as a cell array of two-element row vector.
opt.C_max_ranges    = {[5.5 20]};
ncaparameters2       = sbionca(data1,opt);The function reports the T_max and C_max values within the range by adding two new columns: T_max_5_5__20 and C_max_5_5__20. Note that in the names of these two columns, the last time point is preceded by two consecutive underscores (__).
ncaparameters2.T_max_5_5__20(:)
ans = 4×1
     6
     6
     6
     6
ncaparameters2.C_max_5_5__20(:)
ans = 4×1
    2.2719
    3.0213
   10.0233
   19.9006
Similarly, you can specify a custom time range to compute the partial AUC value for each group.
opt.PartialAreas    = {[0 20]};
ncaparameters3      = sbionca(data1,opt);
ncaparameters3.AUC_0__20(:)ans = 4×1
103 ×
    0.1436
    0.2994
    0.7665
    1.3017
You can also specify multiple time ranges for C_max_ranges and PartialAreas.
opt.C_max_ranges    = {[0 20],[0 10],[0 15]};
opt.PartialAreas    = {[0 12],[0 30]};
ncaparameters4      = sbionca(data1,opt);Output Arguments
Options to calculate NCA parameters, returned as a
                            SimBiology.nca.Options  object. The properties of the
                        object are classified into two groups, data classification options and
                        parameter calculation options.
Data Classification Options
| Property | Description | 
|---|---|
| IVDoseColumnName | Name of the data column that contains the IV dose amount. | 
| EVDoseColumnName | Name of the data column that contains the extravascular (EV) dose amount. | 
| concentrationColumnName | Name of the data column that contains the measured concentrations. | 
| timeColumnName | Name of the data column that contains the time points. | 
| groupColumnName | Name of the data column that contains the grouping
                                                information. You can specify grouping using two
                                                levels of hierarchy. Specify the outer level of
                                                grouping in this column. Specify the inner level of
                                                grouping (subgroups) in
                                                   If you specify  For example, consider data that contains three groups, where each group contains four patients. The group column labels the three groups, and the ID column labels each patient. | 
| idColumnName | Name of the data column that contains the grouping
                                                information. You can specify grouping using two
                                                levels of hierarchy. Specify the inner level of
                                                grouping (subgroups) in this column. Specify the
                                                outer level of grouping in
                                                   If you specify  | 
| infusionRateColumnName | Name of the data column that contains the infusion rates. | 
Parameter Calculation Options
| Property | Description | 
|---|---|
| AUCCalculationMode(since R2024a) | Method to calculate the AUC. There are two methods: 
 
 | 
| LOQ | Lower limit of quantization, a threshold below which the values of dependent variable are truncated to zero. | 
| AdministrationRoute | Drug administration route. Three types of
                                            administration are supported: IVBolus,IVInfusion, andExtraVascular. | 
| TAU | Dosing interval for multiple-dosing data. | 
| SparseData | Boolean that indicates whether or not the values of dependent variable are averaged between subgroups to further populate a profile for a group. Time values for each measurement across subgroups (IDs) within a group must be identical. | 
| Lambda_Z_Time_Min_Max | Two-element row vector that specifies a custom time range to compute the terminal rate constant (Lambda_z). The time range applies to all groups; you cannot specify a different time range for each group. For details, see Noncompartmental Analysis. | 
| PartialAreas | Cell array of one or more two-element row vectors that specify one or more time ranges used to compute the partial AUC values. You can specify multiple rows for group-specific ranges, where the number of rows equal the number of groups. If there is only one row, the same time ranges are used for all groups. | 
| C_max_ranges | Cell array of one or more two-element row vectors
                                                that specify one or more time ranges used to report
                                                the  | 
More About
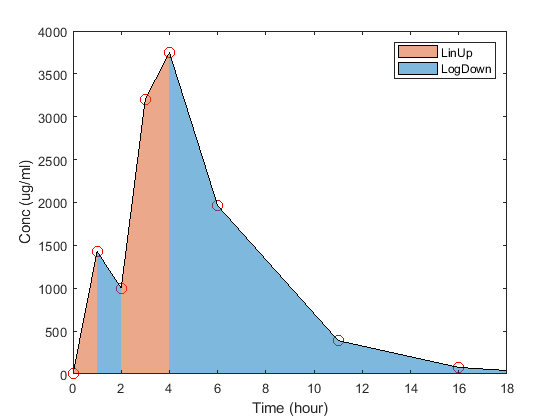
This method uses the linear trapezoidal integration
                    (LinUp) whenever concentrations are increasing or constant,
                and trapezoidal integration of the log-transformed concentrations
                    (LogDown) whenever they are decreasing. 
For the LinUpLogDown method, SimBiology uses the following equation to calculate the AUC for log-transformed concentrations:
where, C1 and C2 are concentrations at times t1 and t2, respectively. ΔT is t2 – t1.
For instance, the next figure illustrates where LinUp and
                    LogDown are used for a given concentration-time course
                depending on whether concentrations are decreasing or increasing.

Version History
Introduced in R2017b
MATLAB Command
You clicked a link that corresponds to this MATLAB command:
Run the command by entering it in the MATLAB Command Window. Web browsers do not support MATLAB commands.
Website auswählen
Wählen Sie eine Website aus, um übersetzte Inhalte (sofern verfügbar) sowie lokale Veranstaltungen und Angebote anzuzeigen. Auf der Grundlage Ihres Standorts empfehlen wir Ihnen die folgende Auswahl: .
Sie können auch eine Website aus der folgenden Liste auswählen:
So erhalten Sie die bestmögliche Leistung auf der Website
Wählen Sie für die bestmögliche Website-Leistung die Website für China (auf Chinesisch oder Englisch). Andere landesspezifische Websites von MathWorks sind für Besuche von Ihrem Standort aus nicht optimiert.
Amerika
- América Latina (Español)
- Canada (English)
- United States (English)
Europa
- Belgium (English)
- Denmark (English)
- Deutschland (Deutsch)
- España (Español)
- Finland (English)
- France (Français)
- Ireland (English)
- Italia (Italiano)
- Luxembourg (English)
- Netherlands (English)
- Norway (English)
- Österreich (Deutsch)
- Portugal (English)
- Sweden (English)
- Switzerland
- United Kingdom (English)