Generate Table Function with Binning Explorer
This example shows you how to generate a table function with the Binning Explorer App. You can use this function in your workflows to return a binned table. In this example, you use internal credit data from a bank, which is organized as panel data.
First, load the panel data set to explore the available predictor variables.
load("creditPanelData.mat")
head(creditPanelData)
ID ScoreGroup YOB Year Checking CreditAmount Age InstallmentRate GDP Market Default
__ __________ ___ ____ ________ ____________ ___ _______________ _____ ______ _______
1 Low Risk 1 1997 A11 1169 67 4 2.72 7.61 0
1 Low Risk 2 1998 A11 1169 67 4 3.57 26.24 0
1 Low Risk 3 1999 A11 1169 67 4 2.86 18.1 0
1 Low Risk 4 2000 A11 1169 67 4 2.43 3.19 0
1 Low Risk 5 2001 A11 1169 67 4 1.26 -10.51 0
1 Low Risk 6 2002 A11 1169 67 4 -0.59 -22.95 0
1 Low Risk 7 2003 A11 1169 67 4 0.63 2.78 0
1 Low Risk 8 2004 A11 1169 67 4 1.85 9.48 0
Next, select a subset of the predictor variables by choosing only the numeric predictors.
isNumeric = strcmp(creditPanelData.Properties.VariableTypes, "double");
numericPanelData = removevars(creditPanelData, ~isNumeric);
head(numericPanelData)
ID YOB Year CreditAmount Age InstallmentRate GDP Market Default
__ ___ ____ ____________ ___ _______________ _____ ______ _______
1 1 1997 1169 67 4 2.72 7.61 0
1 2 1998 1169 67 4 3.57 26.24 0
1 3 1999 1169 67 4 2.86 18.1 0
1 4 2000 1169 67 4 2.43 3.19 0
1 5 2001 1169 67 4 1.26 -10.51 0
1 6 2002 1169 67 4 -0.59 -22.95 0
1 7 2003 1169 67 4 0.63 2.78 0
1 8 2004 1169 67 4 1.85 9.48 0
Launch the Binning Explorer App and click Import Data at the top left of the toolstrip. When the Import Data dialog box opens, set the variable type for the ID variable to Do Not Include, since it is not a predictor. Then, import the data with your preferred algorithm and bin the data interactively.
After you finish binning your data, you can generate a table function by following these steps.
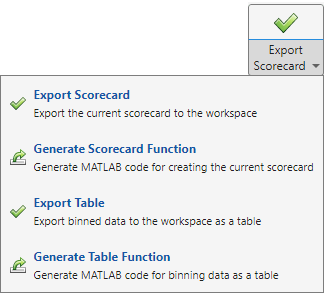
Click the Export button on the Binning Explorer toolstrip.
Click the Export Scorecard button to expand the dropdown menu.
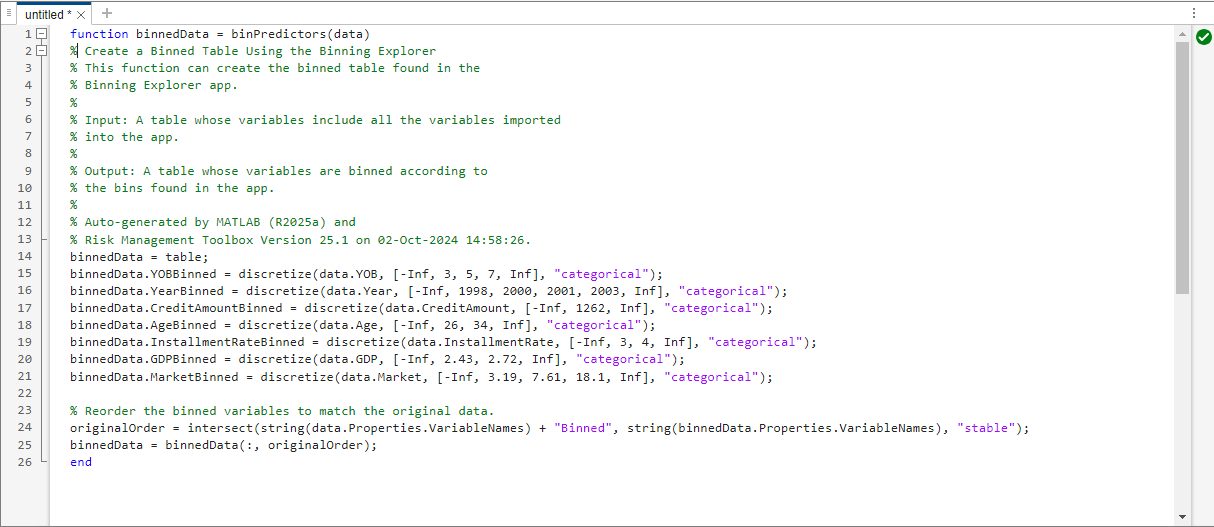
Click Generate Table Function to open an untitled file in your editor that you can modify and save locally.