Analysis of Coplanar Waveguide Transmission Line in X-Band Application
This example shows how to analyze a coplanar waveguide (cpw) transmission line for X-band applications. CPW transmission line consists of a central metal strip separated by a narrow gap from two ground planes on either side. The dimensions of the center strip, the gap, the thickness, and permittivity of the dielectric substrate determine the characteristic impedance, group delay, and noise. The gap in the cpw is usually very small and supports electric fields primarily concentrated in the dielectric.
Define Parameters
The cpw transmission line has 200 mm slot width, 1600 mm conductor width, 635 mm height, 0.005 loss tangent, and 17 um of thickness. This example uses two different dielectric constants to simulate the cpw transmission line. The dielectric constant values are 2.323 and 9.2.
cptxline1 = txlineCPW('EpsilonR',2.323,'SlotWidth',200e-6,'ConductorWidth',...
            1600e-6,'Height',635e-6,'LossTangent',0.005,'Thickness',17e-6);
cptxline2 = txlineCPW('EpsilonR',9.2,'SlotWidth',200e-6,'ConductorWidth',...
            1600e-6,'Height',635e-6,'LossTangent',0.005,'Thickness',17e-6);
% x band Frequency range 8 to 12GHz
freq = 5e9:10e6:14e9;
Plot Input Return Loss
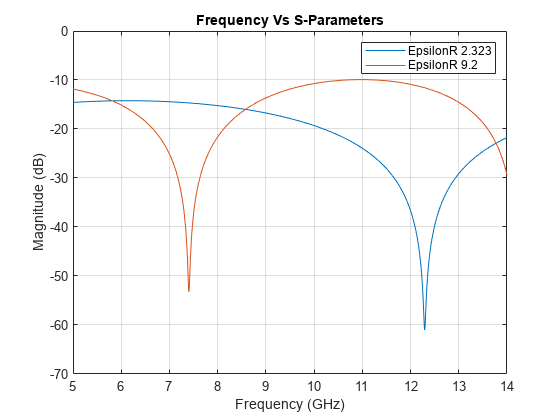
The results for two different dielectric substrates indicates the impedance bandwidth increases with a lower dielectric constant. The measurement results are for a frequency range of 5 GHz to 14GHz, and magnitude of S11 < 10 dB.
figure;
sp1 = sparameters(cptxline1,freq);
sp2 = sparameters(cptxline2,freq);
rfplot(sp1,1,1);hold on;
rfplot(sp2,1,1);
title('Frequency Vs S-Parameters');
legend('EpsilonR 2.323','EpsilonR 9.2');
grid on;
Group Delay
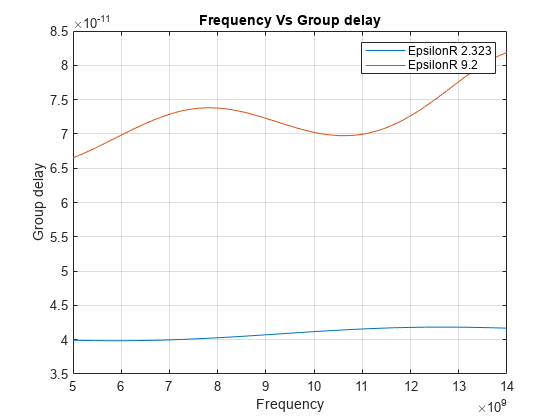
Group delay variations versus frequency is an essential factor when using phase modulation and high data rates. This impairment causes distortion and degradation in wideband applications. In a cpw transmission line the group delay increases with increase in the frequency for both dielectric substrates.
gd1 = groupdelay(cptxline1,freq,'Impedance',50);
gd2 = groupdelay(cptxline2,freq,'Impedance',50);
figure;plot(freq,gd1);hold on;
plot(freq,gd2);
title('Frequency Vs Group delay');
legend('EpsilonR 2.323','EpsilonR 9.2');
xlabel('Frequency');
ylabel('Group delay');
grid on;
Noise Figure
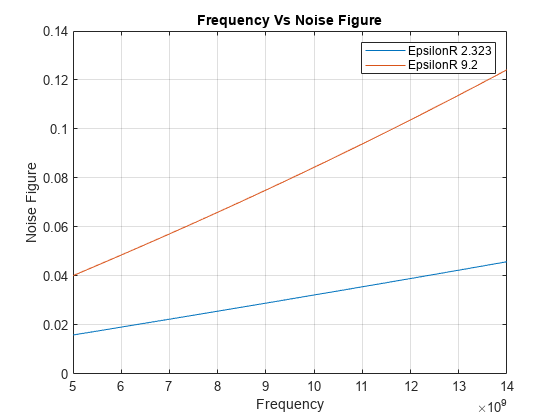
The noise is generated primarily within the input stages of the receiver system itself. Cascaded stages are not noisier than others. The noise generated at the input and amplified by the receiver's full gain amplifier greatly exceeds the noise generated further along the receiver chain. In the results using both lower and higher dielectric constant, noise figure increases with increasing frequency. The variation is very less over the frequency range when using a lower dielectric constant.
nf1 = noisefigure(cptxline1,freq);
nf2 = noisefigure(cptxline2,freq);
figure;plot(freq,nf1);hold on;
plot(freq,nf2);
title('Frequency Vs Noise Figure');
legend('EpsilonR 2.323','EpsilonR 9.2');
xlabel('Frequency');
ylabel('Noise Figure');
grid on;
Characteristic Impedance
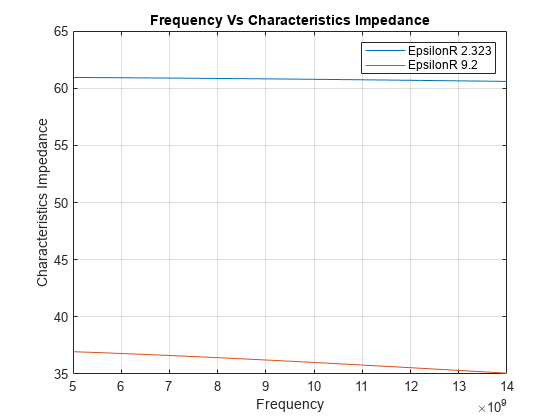
Relative permittivity for a homogeneous dielectric affects the characteristic impedance of cpw transmission line. You can compute this approximately by using the electrical model of the cpw to clarify impedance behavior along the frequency band. Characteristic impedance determines the amount of power transfer and attenuation effect along the cpw transmission line. The characteristic impedance of a transmission line is usually written as Z0. In the simulation, the resulting characteristic impedance decreases with increasing frequency in both dielectric constants. With lower dielectric constant impedance value is below 50 ohms, with higher dielectric constant impedance value is above 50 ohms.
ChImp1 = getZ0(cptxline1,freq);
ChImp2 = getZ0(cptxline2,freq);
figure; plot(freq,ChImp1);hold on;
plot(freq,ChImp2);
title('Frequency Vs Characteristics Impedance');
xlabel('Frequency');
ylabel('Characteristics Impedance');
legend('EpsilonR 2.323','EpsilonR 9.2');
grid on;
Conclusion
In RF and microwave circuit design the dielectric permittivity of the substrate plays an important role and requires precise evaluation over a broad range of frequencies. With the above simulation you see that, lower dielectric constant gives wider bandwidth, lower noise figure, and lower group delay.
Reference:
Sova, M., and I. Bogdan. "Coplanar Waveguide Resonator Design for Array Antenna Applications." In 6th International Conference on Telecommunications in Modern Satellite, Cable and Broadcasting Service, 2003. TELSIKS 2003.,1:57 to 59. Serbia, Montenegro, Nis: IEEE, 2003.