Rectangular Pulse Waveforms
Definition of Rectangular Pulse Waveform
Define the following function of time:
Assume that a radar transmits a signal of the form:
where ωc denotes the carrier frequency. Note that a(t) represents an on-off rectangular amplitude modulation of the carrier frequency. After demodulation, the complex envelope of x(t) is the real-valued rectangular pulse a(t) of duration τ seconds.
How to Create Rectangular Pulse Waveforms
To create a rectangular pulse waveform, use phased.RectangularWaveform. You can customize certain characteristics
of the waveform, including:
Sampling rate
Pulse duration
Pulse repetition frequency
Number of samples or pulses in each vector that represents the waveform
Rectangular Waveform Plot
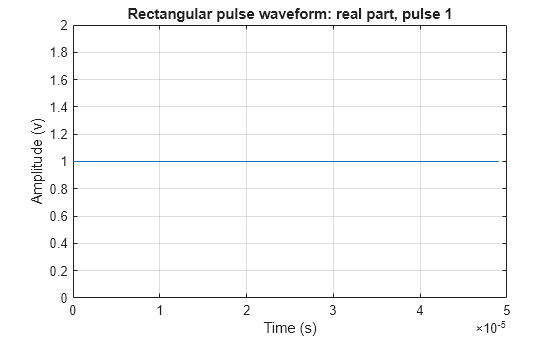
This example shows how to create a rectangular pulse waveform variable using phased.RectangularWaveform. The example also plots the pulse and finds the bandwidth of the pulse.
Construct a rectangular pulse waveform with a duration of 50 μs, a sample rate of 1 MHz, and a pulse repetition frequency (PRF) of 10 kHz.
waveform = phased.RectangularWaveform('SampleRate',1e6,...
    'PulseWidth',50e-6,'PRF',10e3);
Plot a single rectangular pulse by calling plot directly on the rectangular waveform variable. plot is a method of phased.RectangularWaveform. This method produces an annotated graph of your pulse waveform.
plot(waveform)
Find the bandwidth of the rectangular pulse.
bw = bandwidth(waveform)
bw =
20000
The bandwidth, bw, of a rectangular pulse in hertz is approximately the reciprocal of the pulse duration 1/sRect.PulseWidth.
Pulses of Rectangular Waveform
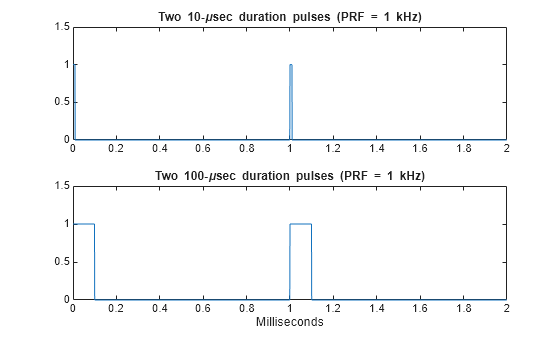
This example shows how to create rectangular pulse waveform signals having different durations. The example plots two pulses of each waveform.
Create a rectangular pulse with a duration of 100 μs and a PRF of 1 kHz. Set the number of pulses in the output equal to two.
waveform = phased.RectangularWaveform('PulseWidth',100e-6,...
    'PRF',1e3,'OutputFormat','Pulses','NumPulses',2);
Make a copy of your rectangular pulse and change the pulse width in your original waveform to 10 μs.
waveform2 = clone(waveform);
waveform.PulseWidth = 10e-6;
sRect and sRect1 now specify different rectangular pulses because you changed the pulse width of waveform.
Execute the System objects to return two pulses of your rectangular pulse waveforms.
y = waveform();
y2 = waveform2();
Plot the real part of the waveforms.
totaldur = 2*1/waveform.PRF;
totnumsamp = totaldur*waveform.SampleRate;
t = unigrid(0,1/waveform.SampleRate,totaldur,'[)');
subplot(2,1,1)
plot(t.*1000,real(y))
axis([0 totaldur*1e3 0 1.5])
title('Two 10-\musec duration pulses (PRF = 1 kHz)')
set(gca,'XTick',0:0.2:totaldur*1e3)
subplot(2,1,2)
plot(t.*1000,real(y2))
axis([0 totaldur*1e3 0 1.5])
xlabel('Milliseconds')
title('Two 100-\musec duration pulses (PRF = 1 kHz)')
set(gca,'XTick',0:0.2:totaldur*1e3)