Counting Steps by Capturing Acceleration Data from Your Mobile Device
This example shows how to collect acceleration data from an Android™ or iOS mobile device and use it to count the number of steps taken.
This example requires Signal Processing Toolbox™.
Set Up Your Mobile Device
In order to receive data from a mobile device in MATLAB®, you will need to install and set up the MATLAB Mobile™ app on your mobile device.
Log in to the MathWorks® Cloud from the MATLAB Mobile Settings.
Create a Connection to Your Mobile Device
On the Commands screen of MATLAB Mobile, use the mobiledev command to create an object that represents your mobile device.
m = mobiledev;
The displayed output should show Connected: 1, indicating that the mobiledev object has successfully established a connection to the app.
Prepare for Data Acquisition
Enable the acceleration sensor on the device.
m.AccelerationSensorEnabled = 1;
Start Acquiring Data
After enabling the sensor, the Sensors screen of MATLAB Mobile will show the current data measured by the sensor. The Logging property allows you to begin sending sensor data to mobiledev.
m.Logging = 1;
The device is now transmitting sensor data.
During logging, the device is held or kept in a pocket while walking around. This generates changes in acceleration across all three axes, regardless of device orientation.
Stop Acquiring Data
The Logging property is used to again to have the device stop sending sensor data to mobiledev.
m.Logging = 0;
Retrieve Logged Data
accellog is used to retrieve the XYZ acceleration data and timestamps transmitted from the device to mobiledev.
[a,t] = accellog(m);
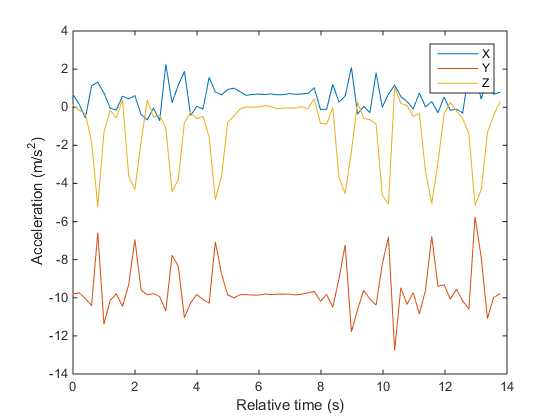
Plot Raw Sensor Data
The logged acceleration data for all three axes can be plotted together.
plot(t,a);
legend('X', 'Y', 'Z');
xlabel('Relative time (s)');
ylabel('Acceleration (m/s^2)');
Process Raw Acceleration Data
To convert the XYZ acceleration vectors at each point in time into scalar values, the magnitude is calculated. This allows large changes in overall acceleration, such as steps taken while walking, to be detected regardless of device orientation.
x = a(:,1);
y = a(:,2);
z = a(:,3);
mag = sqrt(sum(x.^2 + y.^2 + z.^2, 2));
The magnitude is plotted to visualize the general changes in acceleration.
plot(t,mag);
xlabel('Time (s)');
ylabel('Acceleration (m/s^2)');
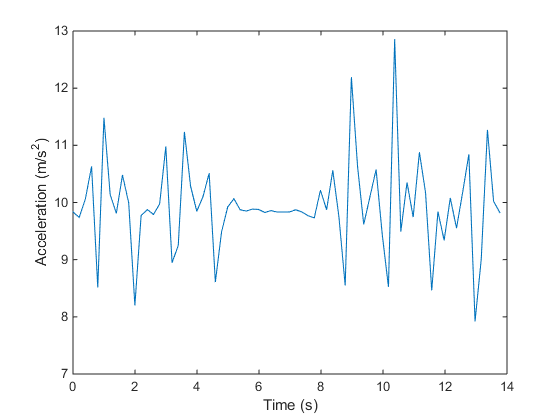
The plot shows that the acceleration magnitude is not zero-mean. Subtracting the mean from the data will remove any constant effects, such as gravity.
magNoG = mag - mean(mag);

plot(t,magNoG);
xlabel('Time (s)');
ylabel('Acceleration (m/s^2)');
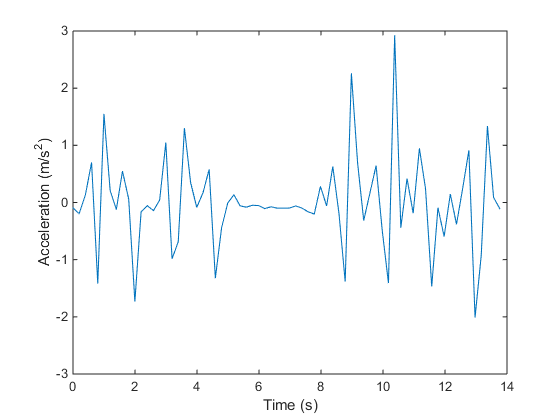
The plotted data is now centered about zero, and clearly shows peaks in acceleration magnitude. Each peak corresponds to a step being taken while walking.
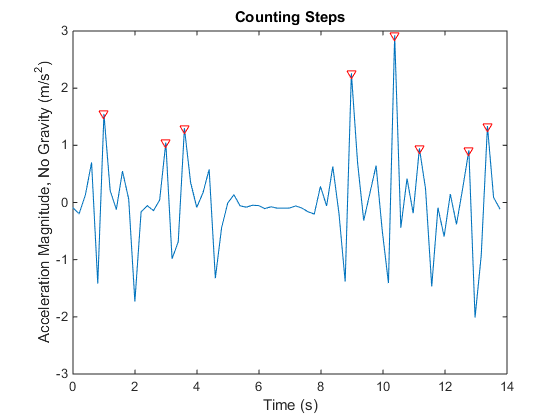
Count the Number of Steps Taken
findpeaks is a function from Signal Processing Toolbox that is used to find the local maxima of the acceleration magnitude data. Only peaks with a minimum height above one standard deviation are treated as a step. This threshold should be tuned experimentally to match a person's level of movement while walking, hardness of floor surfaces, etc.
minPeakHeight = std(magNoG);

[pks,locs] = findpeaks(magNoG,'MINPEAKHEIGHT',minPeakHeight);
The number of steps taken is simply the number of peaks found.
numSteps = numel(pks)
The peak locations can be visualized with the acceleration magnitude data.
hold on;
plot(t(locs), pks, 'r', 'Marker', 'v', 'LineStyle', 'none');
title('Counting Steps');
xlabel('Time (s)');
ylabel('Acceleration Magnitude, No Gravity (m/s^2)');
hold off;
Clean Up
Turn off the acceleration sensor and clear mobiledev.
m.AccelerationSensorEnabled = 0;

clear m;