Acquire and Analyze Audio Data from Mobile Device
This example shows how to use FFT (Fast Fourier Transform) to analyze microphone audio data collected by MATLAB Mobile. A mobile device with Sensor Access turned on is required. To turn on Sensor Access, in the MATLAB Mobile app go to Sensors > More, and switch on Sensor Access.
Connect to Device
Create the connection to the mobile device and enable microphone.
mobileDevObject = mobiledev;
mobileDevObject.MicrophoneEnabled = 1;
Record Background Sound
Turn on the microphone to start recording background noise. Read recorded 2 seconds background audio data. The recorded data is a double matrix of size NumSamples-by-NumChannels. Find the maximum value to set the threshold between background noise and detected speech.
mobileDevObject.logging = 1;
disp('Sampling background noise...')
pause(2)
mobileDevObject.logging = 0;
audioData = readAudio(mobileDevObject);
disp('Maximum sound of the background noise: ')
threshold = max(abs(audioData), [], "all")
Sampling background noise...
Maximum sound of the background noise:

threshold =

    0.0122
Record Speech
Start the speech recording.
disp('Speak into the device microphone for a few seconds. For example, say: ')
mobileDevObject.logging = 1;
tic
disp('"Testing MATLAB Mobile Audio"')
startTime = 0;
totalAudio = [];
Speak into the device microphone for a few seconds. For example, say:
"Testing MATLAB Mobile Audio"
Detect Speech to Trigger Acquisition
Attempt to detect speech for 5 seconds. Pause every 200 ms and read the buffer. If the max value from the window is greater than the threshold*1.5, discard previous collected background audio data and start collecting intended speech audio data. If speech is not detected, process audio data collected in the last 5 seconds.
while toc < 5 && startTime == 0
    pause(.2)
    audioData = readAudio(mobileDevObject);
    if max(abs(audioData)) > threshold * 1.5
        startTime = toc
        totalAudio = audioData;
    else
        totalAudio = vertcat(totalAudio, audioData);
    end
end
startTime =

    1.4202
Acquire Audio Data
Pause every 200 ms and read the buffer. Collect audio data until the speech ends or until the timeout is reached. If no speech is detected in 400 ms, terminate acquisition.
if startTime ~= 0
    numberOfIntervalsStopped = 0;
    while numberOfIntervalsStopped < 2 && toc < 10
        pause(.2)
        audioData = readAudio(mobileDevObject);
        if max(abs(audioData)) < threshold * 1.5
            numberOfIntervalsStopped = numberOfIntervalsStopped + 1;
        else
            numberOfIntervalsStopped = 0;
        end
        totalAudio = vertcat(totalAudio,audioData);
    end
end
mobileDevObject.logging = 0;
Preprocess Audio Data
Only one channel of data is needed. n is the size of leftAudio and is used for graphing and processing. Get the microphone sample rate to determine the frequency scale later.
endTime = toc;
leftAudio = totalAudio(:,1);
n = numel(leftAudio);
if n == 0
    disp(' ')
    disp('No audio data recorded. Try to run the script again.')
    clear mobileDevObject
    return
end
sampleRate = mobileDevObject.Microphone.SampleRate;
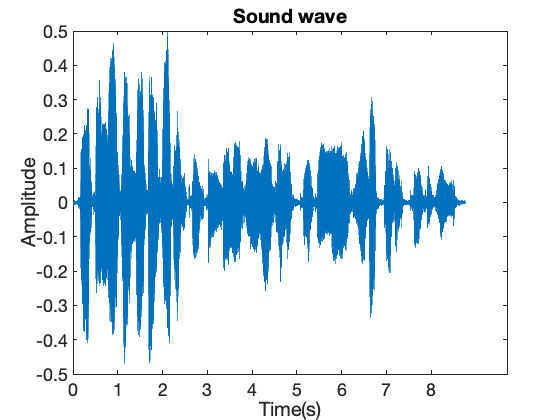
Plot Audio Data in Time Domain
Use elapsed time to determine the timestamps of ticks on the graph. Convert the timestamps to their corresponding sample to find their locations on the x axis. Display them with the xticks function. Use the original ticks array for the labels.
figure(1);
plot(leftAudio)
title('Sound wave');
timeElapsed = endTime - startTime
ticks = 0:floor(timeElapsed);
sampleTicks = ticks * n/timeElapsed;
xticks(sampleTicks)
xticklabels(ticks)
xlabel('Time(s)')
ylabel('Amplitude')
timeElapsed =

    8.7632
Process Audio Data in Frequency Domain
Use the fft function to convert the amplitudes into the frequency-domain given the original time-domain data.
fftData = fft(leftAudio);
% Signal length is equal to the number of samples.
signalLength = n;
% Normalize the FFT data by dividing by signalLength.
fftNormal = abs(fftData/signalLength);
% The second half of the FFT data is a reflection of the first half
% and is not relevant in this case, so remove those values.
fftNormal = fftNormal(1:floor(signalLength/2)+1);
% Multiply the final values by 2 to account for removed values.
fftNormal(2:end-1) = 2*fftNormal(2:end-1);
% freqs is the x-axis scale of the graph.
freqs = sampleRate*(0:(signalLength/2))/signalLength;
% Convert factor from index to frequency.
scale = sampleRate/signalLength;
Plot Audio Data in Frequency Domain of 0-1000 Hz
cutoff = 1000/scale;
figure(2);
plot(freqs(1:floor(cutoff)),fftNormal(1:floor(cutoff)))
title("Frequency Domain Graph")
xlabel("Frequency (Hz)")
ylabel("Amplitude")
ax = gca;
ax.XAxis.Exponent = 0;
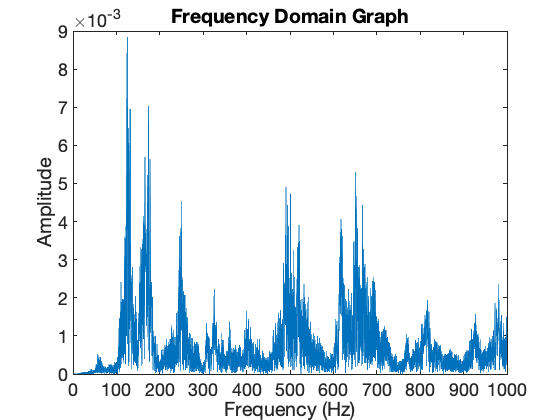
Final Frequency Analysis and Clean Up
Print the dominant frequency, which is the index of the maximum amplitude from the fft. Convert that value to Hz using the calculated scale.
[mVal, mInd] = max(fftNormal);
fprintf("Dominant frequency: %d Hz\n",floor(mInd * scale));
if startTime == 0
    disp(' ')
    disp('The voice of the speech is too low compared to the background noise, analysis might not be precise. Try to run the script again and speak louder.');
end
clear mobileDevObject
Dominant frequency: 125 Hz