Create Maps Using Latitude and Longitude Data
Plot latitude and longitude data on maps by using geographic axes and charts. Geographic axes and charts enable you to provide context for your data by using basemaps, view nearby regions by panning, and view regions in more detail by zooming.
These examples show how to create geographic line plots, scatter plots, bubble charts, and density plots from latitude and longitude data.
Geographic Line Plot
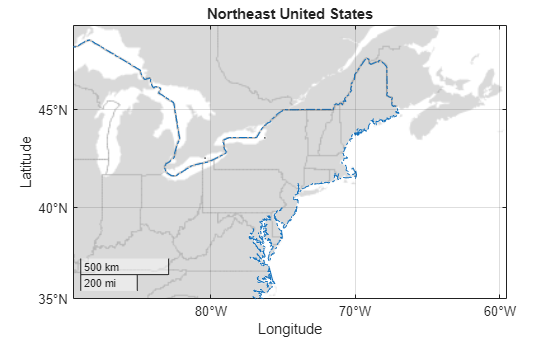
Create geographic line plots by using the geoplot function.
Load a MAT file containing coordinates for the perimeter of the contiguous United States. The file contains two variables: the uslat variable specifies latitude coordinates in degrees, and the uslon variable specifies longitude coordinates in degrees.
load usapolygon.matCreate a line plot from the coordinates by using the geoplot function. Customize the appearance of the line by using a line specification.
figure
geoplot(uslat,uslon,"-.")
Change the latitude and longitude limits of the map by using the geolimits function. Change the basemap by using the geobasemap function. Then, add a title by using the title function.
geolimits([35 49],[-87 -62])
geobasemap grayland
title("Northeast United States")
Geographic Scatter Plot
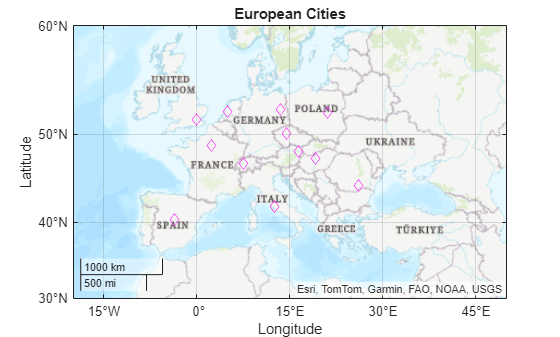
Create geographic scatter plots by using the geoscatter function.
Specify the latitude and longitude coordinates of several European cities.
lat = [48.85 51.5 40.41 41.9 52.52 52.36 52.22 47.49 44.42 50.07 48.20 46.94];
lon = [2.35 -0.12 -3.70 12.49 13.40 4.90 21.01 19.04 26.10 14.43 16.37 7.44];
Create a scatter plot from the coordinates by using the geoscatter function. Use magenta diamonds for the markers.
figure
geoscatter(lat,lon,[],"m","d")
Adjust the latitude and longitude limits of the map by using the geolimits function. Change the basemap by using the geobasemap function. Then, add a title by using the title function.
geolimits([30 60],[-20 50])
geobasemap topographic
title("European Cities")
Standalone Geographic Bubble Chart
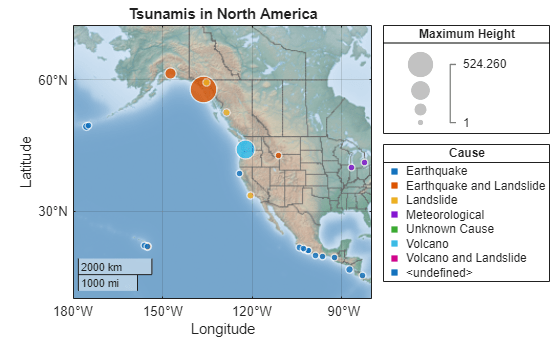
Create standalone geographic bubble charts by using the geobubble function.
Read data about tsunamis into the workspace as a table. Each table row represents an individual tsunami occurrence. The table variables include data about the tsunamis, such as the latitudes, longitudes, causes, and wave heights.
tsunamis = readtable("tsunamis.xlsx");Prepare to color the bubbles according to the causes of the tsunamis. The Cause table variable attributes a cause to each tsunami, such as 'Earthquake' or 'Volcano'. Convert the Cause variable from a cell array of character vectors to a categorical vector.
tsunamis.Cause = categorical(tsunamis.Cause);
Create a geographic bubble chart from the table by using the geobubble function. Specify the tsunami locations using the Latitude and Longitude table variables. Specify the sizes of the bubbles using the wave heights stored in the MaxHeight table variable. Specify the colors of the bubbles using the categories stored in the Cause table variable. Return the geographic bubble chart object as gb.
figure
gb = geobubble(tsunamis,"Latitude","Longitude", ...
    SizeVariable="MaxHeight",ColorVariable="Cause");
Change the latitude and longitude limits of the map by using the geolimits function. Change the basemap by using the geobasemap function.
geolimits([2 68],[-180 -80])
geobasemap colorterrain
Add a title by using the title function. Change the name of the size legend by setting the SizeLegendTitle property of the geographic bubble chart object.
title("Tsunamis in North America")
gb.SizeLegendTitle = "Maximum Height";
Geographic Density Plot
Create geographic density plots by using the geodensityplot function.
Load a table containing cell tower data for California. Each table row represents an individual cell tower. The table variables include data about the cell towers, such as the latitude and longitude coordinates.
load cellularTowers.matExtract the latitude and longitude coordinates from the table.
lat = cellularTowers.Latitude;
lon = cellularTowers.Longitude;
Create a density plot from the coordinates by using the geodensityplot function. Specify the radius of influence for each coordinate as 50 km.
figure
geodensityplot(lat,lon,Radius=50e3)
Add a title by using the title function.
title("Cell Towers in California")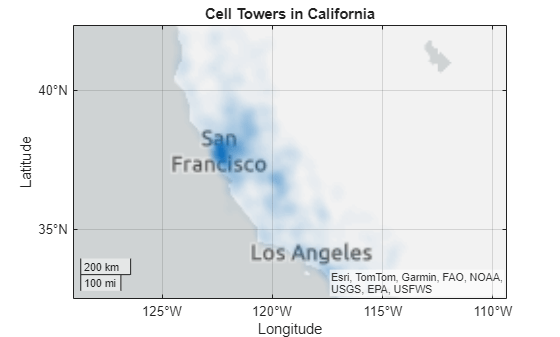
Further Exploration: Use Other Map Projections
Geographic axes and charts use a Web Mercator map projection, which is common for web-based mapping tasks. To create similar maps that use other projections, such as projections that are appropriate for polar regions, use map axes in Mapping Toolbox™. For more information about map axes, see Create 2-D Plots Using Map Axes (Mapping Toolbox).