Control Categorical Histogram Display
This example shows how to use histogram to effectively view categorical data. You can use the name-value pairs 'NumDisplayBins', 'DisplayOrder', and 'ShowOthers' to change the display of a categorical histogram. These options help you to better organize the data and reduce noise in the plot.
Create Categorical Histogram
The sample file outages.csv contains data representing electric utility outages in the United States. The file contains six columns: Region, OutageTime, Loss, Customers, RestorationTime, and Cause.
Read the outages.csv file as a table. Use the 'Format' option to specify the kind of data each column contains: categorical ('%C'), floating-point numeric ('%f'), or datetime ('%D'). Index into the first few rows of data to see the variables.
data_formats = '%C%D%f%f%D%C';
C = readtable('outages.csv','Format',data_formats);
first_few_rows = C(1:10,:)
first_few_rows=10×6 table
     Region         OutageTime        Loss     Customers     RestorationTime          Cause
    _________    ________________    ______    __________    ________________    _______________

    SouthWest    2002-02-01 12:18    458.98    1.8202e+06    2002-02-07 16:50    winter storm
    SouthEast    2003-01-23 00:49    530.14    2.1204e+05                 NaT    winter storm
    SouthEast    2003-02-07 21:15     289.4    1.4294e+05    2003-02-17 08:14    winter storm
    West         2004-04-06 05:44    434.81    3.4037e+05    2004-04-06 06:10    equipment fault
    MidWest      2002-03-16 06:18    186.44    2.1275e+05    2002-03-18 23:23    severe storm
    West         2003-06-18 02:49         0             0    2003-06-18 10:54    attack
    West         2004-06-20 14:39    231.29           NaN    2004-06-20 19:16    equipment fault
    West         2002-06-06 19:28    311.86           NaN    2002-06-07 00:51    equipment fault
    NorthEast    2003-07-16 16:23    239.93         49434    2003-07-17 01:12    fire
    MidWest      2004-09-27 11:09    286.72         66104    2004-09-27 16:37    equipment fault
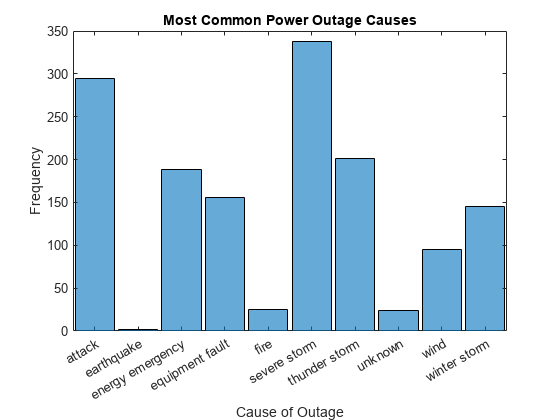
Plot a categorical histogram of the Cause variable. Specify an output argument to return a handle to the histogram object.
h = histogram(C.Cause);
xlabel('Cause of Outage')
ylabel('Frequency')
title('Most Common Power Outage Causes')
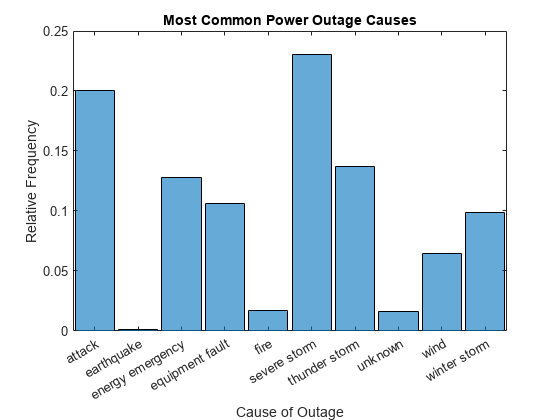
Change the normalization of the histogram to use the 'probability' normalization, which displays the relative frequency of each outage cause.
h.Normalization = 'probability';
ylabel('Relative Frequency')
Change Display Order
Use the 'DisplayOrder' option to sort the bins from largest to smallest.
h.DisplayOrder = 'descend';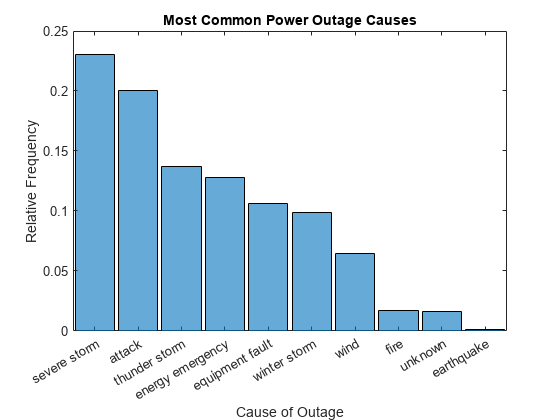
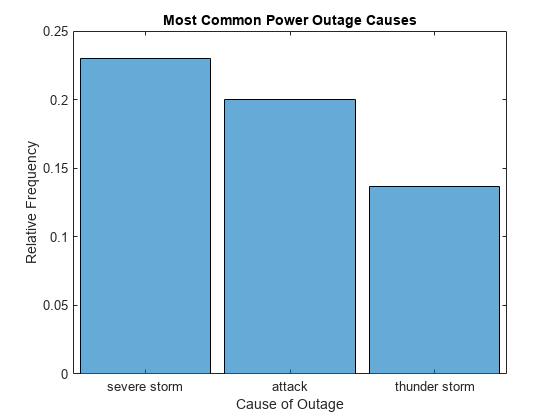
Truncate Number of Bars Displayed
Use the 'NumDisplayBins' option to display only three bars in the plot. The displayed probabilities no longer add to 1 since the undisplayed data is still taken into account for normalization.
h.NumDisplayBins = 3;
Summarize Excluded Data
Use the 'ShowOthers' option to summarize all of the excluded bars, so that the displayed probabilities again add to 1.
h.ShowOthers = 'on';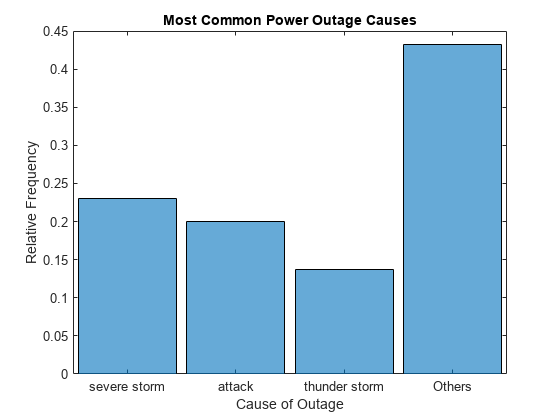
Limit Normalization to Display Data
Prior to R2017a, the histogram and histcounts functions used only binned data to calculate normalizations. This behavior meant that if some of the data ended up outside the bins, it was ignored for the purposes of normalization. However, in MATLAB® R2017a, the behavior changed to always normalize using the total number of elements in the input data. The new behavior is more intuitive, but if you prefer the old behavior, then you need to take a few special steps to limit the normalization only to the binned data.
Instead of normalizing over all of the input data, you can limit the probability normalization to the data that is displayed in the histogram. Simply update the Data property of the histogram object to remove the other categories. The Categories property reflects the categories displayed in the histogram. Use setdiff to compare the two property values and remove any category from Data that is not in Categories. Then remove all of the resulting undefined categorical elements from the data, leaving only elements in the displayed categories.
h.ShowOthers = 'off';
cats_to_remove = setdiff(categories(h.Data),h.Categories);
h.Data = removecats(h.Data,cats_to_remove);
h.Data = rmmissing(h.Data);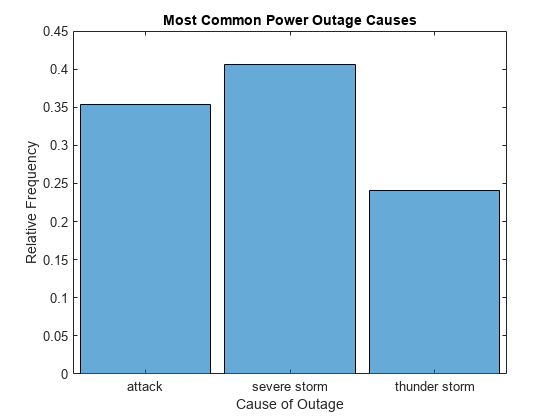
The normalization is now based only on the three remaining categories, so the three bars add to 1.