ingeoquad
True for points inside or on lat-lon quadrangle
Syntax
tf = ingeoquad(lat, lon, latlim, lonlim)
Description
tf = ingeoquad(lat, lon, latlim, lonlim) returns
an array tf that has the same size as lat and lon.
tf(k) is true if and only if the point lat(k), lon(k) falls
within or on the edge of the geographic quadrangle defined by latlim and lonlim.
latlim is a vector of the form [southern-limit
northern-limit], and lonlim is a vector
of the form [western-limit eastern-limit]. All
angles are in units of degrees.
Examples
Load elevation data and a geographic cells reference object for the Korean peninsula. Display the data on a world map. Apply a colormap appropriate for elevation data.
load korea5c
worldmap([20 50],[90 150])
geoshow(korea5c,korea5cR,DisplayType="texturemap")
demcmap(korea5c)
Outline the quadrangle that contains the elevation data.
latlim = korea5cR.LatitudeLimits;
lonlim = korea5cR.LongitudeLimits;
[outlineLat,outlineLon] = outlinegeoquad(latlim,lonlim,90,5);
geoshow(outlineLat,outlineLon,DisplayType="line",Color="k")
Create and display a track that crosses the elevation data.
[lat,lon] = track2(23,110,48,149,[1 0],"degrees",20);
geoshow(lat,lon,DisplayType="line")
Identify and mark points on the track that fall within the quadrangle that outlines the elevation data.
tf = ingeoquad(lat,lon,latlim,lonlim);
geoshow(lat(tf),lon(tf),DisplayType="point");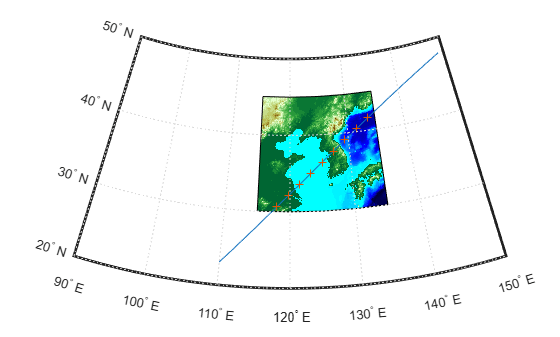
Version History
Introduced in R2008a